
An official website of the United States government
An official website of the United States government
The .gov means it's official.
Federal government websites often end in .gov or .mil. Before sharing sensitive information,
make sure you're on a federal government site.
The site is secure.
The
https:// ensures that you are connecting to the official website and that any
information you provide is encrypted and transmitted securely.
This major group comprises the following occupations: Architects, Except Landscape and Naval ; Landscape Architects ; Cartographers and Photogrammetrists ; Surveyors ; Aerospace Engineers ; Agricultural Engineers ; Biomedical Engineers ; Chemical Engineers ; Civil Engineers ; Computer Hardware Engineers ; Electrical Engineers ; Electronics Engineers, Except Computer ; Environmental Engineers ; Health and Safety Engineers, Except Mining Safety Engineers and Inspectors ; Industrial Engineers ; Marine Engineers and Naval Architects ; Materials Engineers ; Mechanical Engineers ; Mining and Geological Engineers, Including Mining Safety Engineers ; Nuclear Engineers ; Petroleum Engineers ; Engineers, All Other ; Architectural and Civil Drafters ; Electrical and Electronics Drafters ; Mechanical Drafters ; Drafters, All Other ; Aerospace Engineering and Operations Technicians ; Civil Engineering Technicians ; Electrical and Electronics Engineering Technicians ; Electro-Mechanical Technicians ; Environmental Engineering Technicians ; Industrial Engineering Technicians ; Mechanical Engineering Technicians ; Engineering Technicians, Except Drafters, All Other ; Surveying and Mapping Technicians
Employment estimate and mean wage estimates for this major group:
| Employment (1) | Employment RSE (3) |
Mean hourly wage |
Mean annual wage (2) |
Wage RSE (3) |
|---|---|---|---|---|
| 2,499,050 | 0.6 % | $40.53 | $84,300 | 0.3 % |
Percentile wage estimates for this major group:
| Percentile | 10% | 25% | 50% (Median) |
75% | 90% |
|---|---|---|---|---|---|
| Hourly Wage | $20.46 | $27.66 | $37.45 | $50.06 | $64.15 |
| Annual Wage (2) | $42,550 | $57,540 | $77,900 | $104,130 | $133,440 |
Industries with the highest published employment and wages for this occupation are provided. For a list of all industries with employment in this occupation, see the Create Customized Tables function.
Industries with the highest levels of employment in this occupation:
| Industry | Employment (1) | Percent of industry employment | Hourly mean wage | Annual mean wage (2) |
|---|---|---|---|---|
| Architectural, Engineering, and Related Services | 698,690 | 49.91 | $37.85 | $78,730 |
| Federal Executive Branch (OES Designation) | 124,210 | 6.14 | $47.82 | $99,460 |
| Aerospace Product and Parts Manufacturing | 102,360 | 20.85 | $48.27 | $100,390 |
| Scientific Research and Development Services | 102,270 | 15.21 | $48.64 | $101,160 |
| Semiconductor and Other Electronic Component Manufacturing | 95,730 | 25.90 | $43.68 | $90,860 |
Industries with the highest concentration of employment in this occupation:
| Industry | Employment (1) | Percent of industry employment | Hourly mean wage | Annual mean wage (2) |
|---|---|---|---|---|
| Architectural, Engineering, and Related Services | 698,690 | 49.91 | $37.85 | $78,730 |
| Semiconductor and Other Electronic Component Manufacturing | 95,730 | 25.90 | $43.68 | $90,860 |
| Navigational, Measuring, Electromedical, and Control Instruments Manufacturing | 84,060 | 21.49 | $43.92 | $91,350 |
| Aerospace Product and Parts Manufacturing | 102,360 | 20.85 | $48.27 | $100,390 |
| Communications Equipment Manufacturing | 16,920 | 19.39 | $43.38 | $90,230 |
Top paying industries for this occupation:
| Industry | Employment (1) | Percent of industry employment | Hourly mean wage | Annual mean wage (2) |
|---|---|---|---|---|
| Oil and Gas Extraction | 22,970 | 12.66 | $61.45 | $127,820 |
| Depository Credit Intermediation | 100 | 0.01 | $56.15 | $116,790 |
| Pipeline Transportation of Crude Oil | 1,990 | 18.52 | $54.91 | $114,220 |
| Other Information Services | 420 | 0.16 | $54.20 | $112,740 |
| Grantmaking and Giving Services | 40 | 0.03 | $53.81 | $111,930 |
States and areas with the highest published employment, location quotients, and wages for this occupation are provided. For a list of all areas with employment in this occupation, see the Create Customized Tables function.
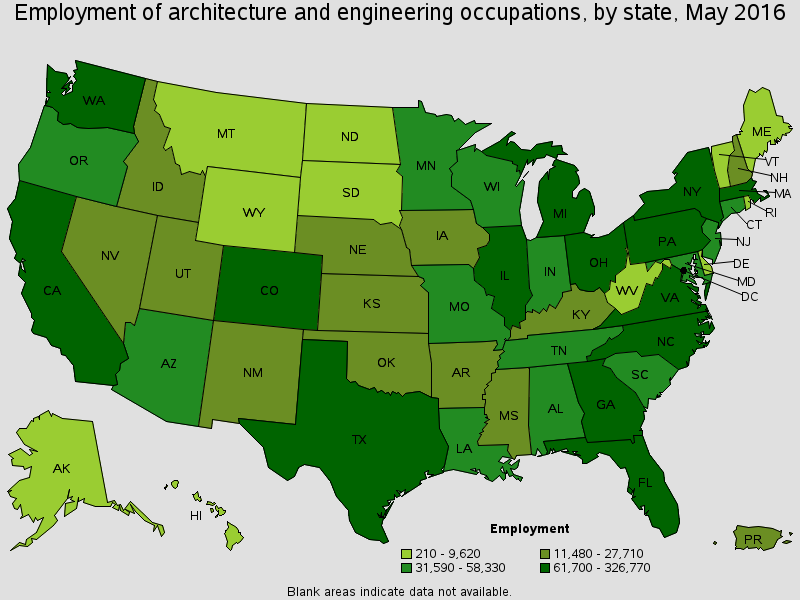
States with the highest employment level in this occupation:
| State | Employment (1) | Employment per thousand jobs | Location quotient (9) | Hourly mean wage | Annual mean wage (2) |
|---|---|---|---|---|---|
| California | 326,770 | 20.47 | 1.15 | $47.29 | $98,370 |
| Texas | 237,260 | 20.20 | 1.13 | $44.51 | $92,580 |
| Michigan | 135,060 | 32.07 | 1.80 | $38.59 | $80,270 |
| New York | 112,600 | 12.38 | 0.70 | $39.85 | $82,900 |
| Florida | 101,260 | 12.32 | 0.69 | $35.39 | $73,600 |
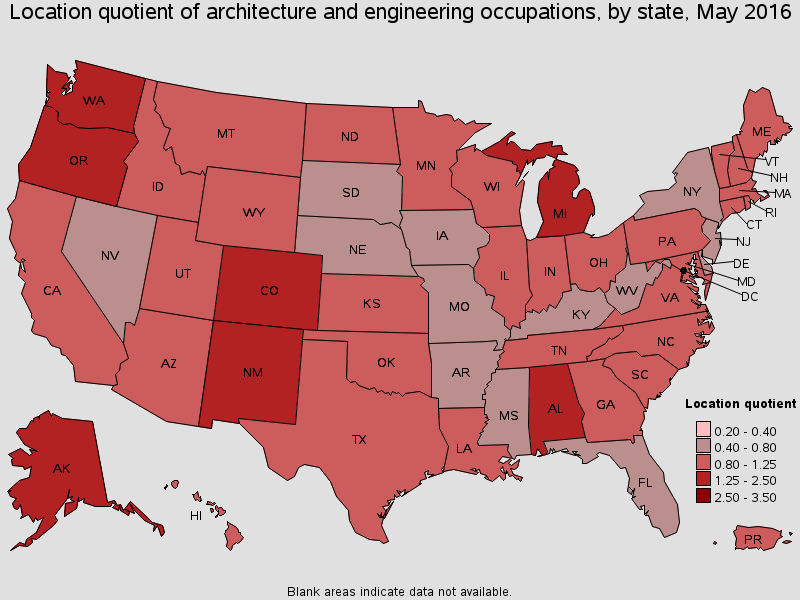
States with the highest concentration of jobs and location quotients in this occupation:
| State | Employment (1) | Employment per thousand jobs | Location quotient (9) | Hourly mean wage | Annual mean wage (2) |
|---|---|---|---|---|---|
| Michigan | 135,060 | 32.07 | 1.80 | $38.59 | $80,270 |
| New Mexico | 21,250 | 26.38 | 1.48 | $43.28 | $90,030 |
| Washington | 77,830 | 25.37 | 1.43 | $44.31 | $92,170 |
| Colorado | 61,700 | 24.60 | 1.38 | $43.07 | $89,580 |
| Alaska | 7,710 | 23.83 | 1.34 | $50.74 | $105,530 |
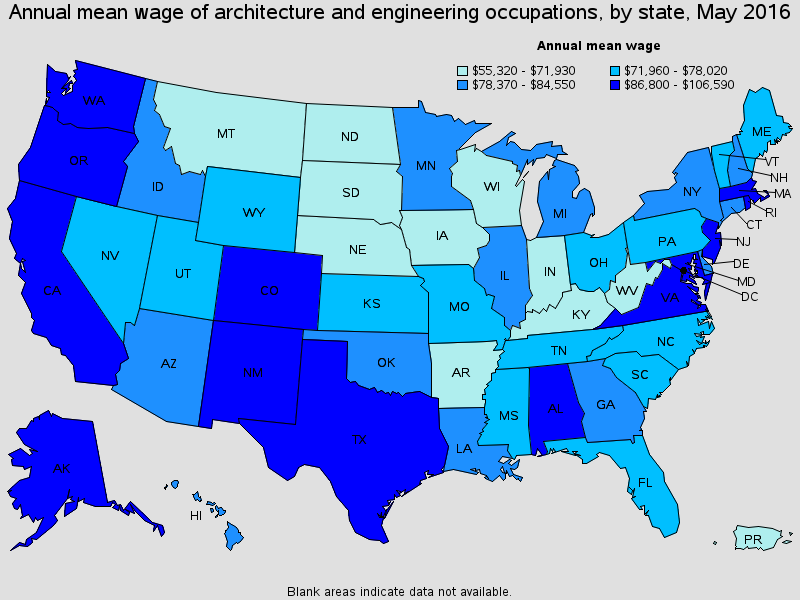
Top paying States for this occupation:
| State | Employment (1) | Employment per thousand jobs | Location quotient (9) | Hourly mean wage | Annual mean wage (2) |
|---|---|---|---|---|---|
| District of Columbia | 11,520 | 16.40 | 0.92 | $51.25 | $106,590 |
| Alaska | 7,710 | 23.83 | 1.34 | $50.74 | $105,530 |
| California | 326,770 | 20.47 | 1.15 | $47.29 | $98,370 |
| Maryland | 58,330 | 22.09 | 1.24 | $45.35 | $94,330 |
| Texas | 237,260 | 20.20 | 1.13 | $44.51 | $92,580 |
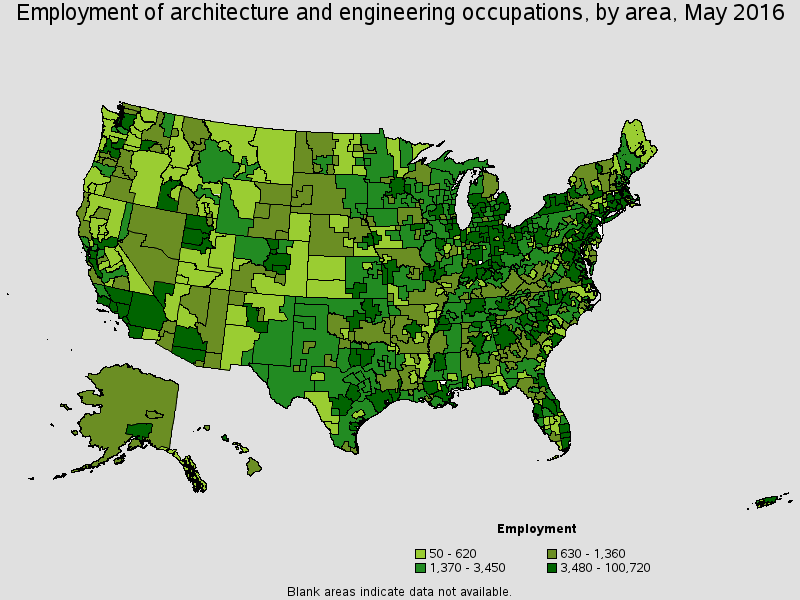
Metropolitan areas with the highest employment level in this occupation:
| Metropolitan area | Employment (1) | Employment per thousand jobs | Location quotient (9) | Hourly mean wage | Annual mean wage (2) |
|---|---|---|---|---|---|
| Houston-The Woodlands-Sugar Land, TX | 87,500 | 29.81 | 1.68 | $50.31 | $104,640 |
| New York-Jersey City-White Plains, NY-NJ Metropolitan Division | 64,400 | 9.78 | 0.55 | $41.70 | $86,730 |
| Los Angeles-Long Beach-Glendale, CA Metropolitan Division | 62,890 | 14.90 | 0.84 | $46.85 | $97,450 |
| Warren-Troy-Farmington Hills, MI Metropolitan Division | 60,120 | 49.83 | 2.80 | $39.98 | $83,150 |
| San Jose-Sunnyvale-Santa Clara, CA | 56,740 | 54.28 | 3.05 | $55.29 | $115,010 |
| Chicago-Naperville-Arlington Heights, IL Metropolitan Division | 52,790 | 14.51 | 0.82 | $39.23 | $81,600 |
| Seattle-Bellevue-Everett, WA Metropolitan Division | 51,860 | 32.65 | 1.83 | $46.28 | $96,250 |
| Dallas-Plano-Irving, TX Metropolitan Division | 49,710 | 20.46 | 1.15 | $43.53 | $90,550 |
| Washington-Arlington-Alexandria, DC-VA-MD-WV Metropolitan Division | 49,000 | 19.67 | 1.11 | $48.84 | $101,580 |
| Boston-Cambridge-Newton, MA NECTA Division | 44,700 | 24.79 | 1.39 | $44.66 | $92,900 |
Metropolitan areas with the highest concentration of jobs and location quotients in this occupation:
| Metropolitan area | Employment (1) | Employment per thousand jobs | Location quotient (9) | Hourly mean wage | Annual mean wage (2) |
|---|---|---|---|---|---|
| California-Lexington Park, MD | 5,240 | 119.14 | 6.69 | $49.92 | $103,840 |
| Huntsville, AL | 18,130 | 83.07 | 4.67 | $48.45 | $100,770 |
| Norwich-New London-Westerly, CT-RI | 7,170 | 56.44 | 3.17 | $39.46 | $82,080 |
| San Jose-Sunnyvale-Santa Clara, CA | 56,740 | 54.28 | 3.05 | $55.29 | $115,010 |
| Warren-Troy-Farmington Hills, MI Metropolitan Division | 60,120 | 49.83 | 2.80 | $39.98 | $83,150 |
| Bremerton-Silverdale, WA | 4,180 | 49.82 | 2.80 | $40.25 | $83,720 |
| Kennewick-Richland, WA | 5,070 | 47.27 | 2.66 | $49.07 | $102,070 |
| Framingham, MA NECTA Division | 7,810 | 44.79 | 2.52 | $46.75 | $97,240 |
| Boulder, CO | 7,430 | 42.13 | 2.37 | $46.71 | $97,150 |
| Jackson, MI | 2,480 | 41.99 | 2.36 | $39.64 | $82,450 |
Top paying metropolitan areas for this occupation:
| Metropolitan area | Employment (1) | Employment per thousand jobs | Location quotient (9) | Hourly mean wage | Annual mean wage (2) |
|---|---|---|---|---|---|
| San Jose-Sunnyvale-Santa Clara, CA | 56,740 | 54.28 | 3.05 | $55.29 | $115,010 |
| Midland, TX | 2,870 | 33.24 | 1.87 | $53.41 | $111,090 |
| Anchorage, AK | 5,070 | 28.80 | 1.62 | $52.35 | $108,890 |
| Houston-The Woodlands-Sugar Land, TX | 87,500 | 29.81 | 1.68 | $50.31 | $104,640 |
| San Francisco-Redwood City-South San Francisco, CA Metropolitan Division | 22,450 | 21.04 | 1.18 | $50.29 | $104,590 |
| California-Lexington Park, MD | 5,240 | 119.14 | 6.69 | $49.92 | $103,840 |
| Kennewick-Richland, WA | 5,070 | 47.27 | 2.66 | $49.07 | $102,070 |
| Washington-Arlington-Alexandria, DC-VA-MD-WV Metropolitan Division | 49,000 | 19.67 | 1.11 | $48.84 | $101,580 |
| Huntsville, AL | 18,130 | 83.07 | 4.67 | $48.45 | $100,770 |
| Bakersfield, CA | 7,750 | 26.35 | 1.48 | $48.45 | $100,770 |
Nonmetropolitan areas with the highest employment in this occupation:
| Nonmetropolitan area | Employment (1) | Employment per thousand jobs | Location quotient (9) | Hourly mean wage | Annual mean wage (2) |
|---|---|---|---|---|---|
| West Northwestern Ohio nonmetropolitan area | 5,830 | 23.07 | 1.30 | $32.34 | $67,260 |
| Balance of Lower Peninsula of Michigan nonmetropolitan area | 5,410 | 19.41 | 1.09 | $32.82 | $68,260 |
| Southern Indiana nonmetropolitan area | 5,000 | 26.72 | 1.50 | $35.30 | $73,430 |
| North Northeastern Ohio non-metropolitan area (non-contiguous) | 4,820 | 14.60 | 0.82 | $32.87 | $68,370 |
| Southwest New York nonmetropolitan area | 4,140 | 22.61 | 1.27 | $36.66 | $76,250 |
Nonmetropolitan areas with the highest concentration of jobs and location quotients in this occupation:
| Nonmetropolitan area | Employment (1) | Employment per thousand jobs | Location quotient (9) | Hourly mean wage | Annual mean wage (2) |
|---|---|---|---|---|---|
| Los Alamos County, New Mexico nonmetropolitan area | 2,480 | 163.95 | 9.21 | $54.11 | $112,550 |
| Northeast Virginia nonmetropolitan area | 2,870 | 58.11 | 3.26 | $48.09 | $100,020 |
| Upper Savannah South Carolina nonmetropolitan area | 2,270 | 28.48 | 1.60 | $34.61 | $71,980 |
| Southern Indiana nonmetropolitan area | 5,000 | 26.72 | 1.50 | $35.30 | $73,430 |
| Southwest Wyoming nonmetropolitan area | 1,520 | 25.03 | 1.41 | $41.74 | $86,820 |
Top paying nonmetropolitan areas for this occupation:
| Nonmetropolitan area | Employment (1) | Employment per thousand jobs | Location quotient (9) | Hourly mean wage | Annual mean wage (2) |
|---|---|---|---|---|---|
| Los Alamos County, New Mexico nonmetropolitan area | 2,480 | 163.95 | 9.21 | $54.11 | $112,550 |
| Balance of Alaska nonmetropolitan area | 1,250 | 16.92 | 0.95 | $52.39 | $108,970 |
| Northeast Virginia nonmetropolitan area | 2,870 | 58.11 | 3.26 | $48.09 | $100,020 |
| Southeast Alaska nonmetropolitan area | 510 | 14.48 | 0.81 | $42.24 | $87,870 |
| Eastern Sierra Region of California nonmetropolitan area | 110 | 8.12 | 0.46 | $42.21 | $87,800 |
These estimates are calculated with data collected from employers in all industry sectors, all metropolitan and nonmetropolitan areas, and all states and the District of Columbia.
The percentile wage estimate is the value of a wage below which a certain percent of workers fall. The median wage is the 50th percentile wage estimate--50 percent of workers earn less than the median and 50 percent of workers earn more than the median. More about percentile wages.
(1) Estimates for detailed occupations do not sum to the totals because the totals include occupations not shown separately. Estimates do not include self-employed workers.
(2) Annual wages have been calculated by multiplying the hourly mean wage by a "year-round, full-time" hours figure of 2,080 hours; for those occupations where there is not an hourly wage published, the annual wage has been directly calculated from the reported survey data.
(3) The relative standard error (RSE) is a measure of the reliability of a survey statistic. The smaller the relative standard error, the more precise the estimate.
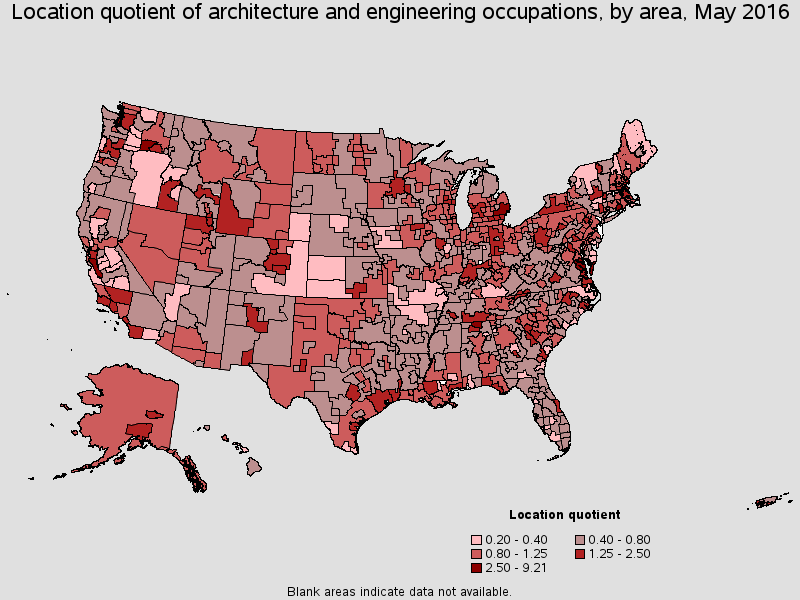
(9) The location quotient is the ratio of the area concentration of occupational employment to the national average concentration. A location quotient greater than one indicates the occupation has a higher share of employment than average, and a location quotient less than one indicates the occupation is less prevalent in the area than average.
Other OES estimates and related information:
May 2016 National Occupational Employment and Wage Estimates
May 2016 State Occupational Employment and Wage Estimates
May 2016 Metropolitan and Nonmetropolitan Area Occupational Employment and Wage Estimates
May 2016 National Industry-Specific Occupational Employment and Wage Estimates
Last Modified Date: March 31, 2017