
An official website of the United States government
An official website of the United States government
The .gov means it's official.
Federal government websites often end in .gov or .mil. Before sharing sensitive information,
make sure you're on a federal government site.
The site is secure.
The
https:// ensures that you are connecting to the official website and that any
information you provide is encrypted and transmitted securely.
This major group comprises the following occupations: Business Teachers, Postsecondary ; Computer Science Teachers, Postsecondary ; Mathematical Science Teachers, Postsecondary ; Architecture Teachers, Postsecondary ; Engineering Teachers, Postsecondary ; Agricultural Sciences Teachers, Postsecondary ; Biological Science Teachers, Postsecondary ; Forestry and Conservation Science Teachers, Postsecondary ; Atmospheric, Earth, Marine, and Space Sciences Teachers, Postsecondary ; Chemistry Teachers, Postsecondary ; Environmental Science Teachers, Postsecondary ; Physics Teachers, Postsecondary ; Anthropology and Archeology Teachers, Postsecondary ; Area, Ethnic, and Cultural Studies Teachers, Postsecondary ; Economics Teachers, Postsecondary ; Geography Teachers, Postsecondary ; Political Science Teachers, Postsecondary ; Psychology Teachers, Postsecondary ; Sociology Teachers, Postsecondary ; Social Sciences Teachers, Postsecondary, All Other ; Health Specialties Teachers, Postsecondary ; Nursing Instructors and Teachers, Postsecondary ; Education Teachers, Postsecondary ; Library Science Teachers, Postsecondary ; Criminal Justice and Law Enforcement Teachers, Postsecondary ; Law Teachers, Postsecondary ; Social Work Teachers, Postsecondary ; Art, Drama, and Music Teachers, Postsecondary ; Communications Teachers, Postsecondary ; English Language and Literature Teachers, Postsecondary ; Foreign Language and Literature Teachers, Postsecondary ; History Teachers, Postsecondary ; Philosophy and Religion Teachers, Postsecondary ; Graduate Teaching Assistants ; Home Economics Teachers, Postsecondary ; Recreation and Fitness Studies Teachers, Postsecondary ; Vocational Education Teachers, Postsecondary ; Postsecondary Teachers, All Other ; Preschool Teachers, Except Special Education ; Kindergarten Teachers, Except Special Education ; Elementary School Teachers, Except Special Education ; Middle School Teachers, Except Special and Career/Technical Education ; Career/Technical Education Teachers, Middle School ; Secondary School Teachers, Except Special and Career/Technical Education ; Career/Technical Education Teachers, Secondary School ; Special Education Teachers, Preschool ; Special Education Teachers, Kindergarten and Elementary School ; Special Education Teachers, Middle School ; Special Education Teachers, Secondary School ; Special Education Teachers, All Other ; Adult Basic and Secondary Education and Literacy Teachers and Instructors ; Self-Enrichment Education Teachers ; Teachers and Instructors, All Other, Except Substitute Teachers ; Substitute Teachers ; Archivists ; Curators ; Museum Technicians and Conservators ; Librarians ; Library Technicians ; Audio-Visual and Multimedia Collections Specialists ; Farm and Home Management Advisors ; Instructional Coordinators ; Teacher Assistants ; Education, Training, and Library Workers, All Other
Employment estimate and mean wage estimates for this major group:
| Employment (1) | Employment RSE (3) |
Mean hourly wage |
Mean annual wage (2) |
Wage RSE (3) |
|---|---|---|---|---|
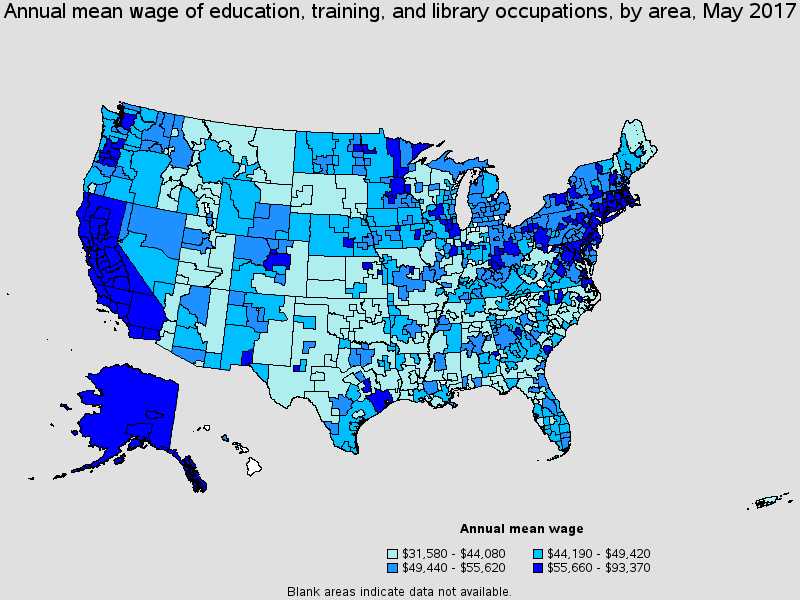
| 8,727,710 | 0.3 % | $26.67 | $55,470 | 0.5 % |
Percentile wage estimates for this major group:
| Percentile | 10% | 25% | 50% (Median) |
75% | 90% |
|---|---|---|---|---|---|
| Hourly Wage | $10.71 | $15.42 | $23.43 | $33.09 | $45.62 |
| Annual Wage (2) | $22,270 | $32,070 | $48,740 | $68,830 | $94,900 |
Industries with the highest published employment and wages for this occupation are provided. For a list of all industries with employment in this occupation, see the Create Customized Tables function.
Industries with the highest levels of employment in this occupation:
| Industry | Employment (1) | Percent of industry employment | Hourly mean wage | Annual mean wage (2) |
|---|---|---|---|---|
| Elementary and Secondary Schools | 5,664,560 | 66.82 | $25.11 | $52,240 |
| Colleges, Universities, and Professional Schools | 1,231,630 | 40.80 | $39.03 | $81,180 |
| Junior Colleges | 433,030 | 58.82 | $34.29 | $71,330 |
| Child Day Care Services | 432,300 | 49.01 | $13.60 | $28,290 |
| Other Schools and Instruction | 231,680 | 54.06 | $21.28 | $44,270 |
Industries with the highest concentration of employment in this occupation:
| Industry | Employment (1) | Percent of industry employment | Hourly mean wage | Annual mean wage (2) |
|---|---|---|---|---|
| Elementary and Secondary Schools | 5,664,560 | 66.82 | $25.11 | $52,240 |
| Junior Colleges | 433,030 | 58.82 | $34.29 | $71,330 |
| Other Schools and Instruction | 231,680 | 54.06 | $21.28 | $44,270 |
| Child Day Care Services | 432,300 | 49.01 | $13.60 | $28,290 |
| Technical and Trade Schools | 63,460 | 47.44 | $25.99 | $54,060 |
Top paying industries for this occupation:
| Industry | Employment (1) | Percent of industry employment | Hourly mean wage | Annual mean wage (2) |
|---|---|---|---|---|
| Outpatient Care Centers | 3,850 | 0.44 | $50.81 | $105,690 |
| General Medical and Surgical Hospitals | 20,210 | 0.37 | $49.04 | $102,000 |
| Commercial and Industrial Machinery and Equipment (except Automotive and Electronic) Repair and Maintenance | (8) | (8) | $42.59 | $88,580 |
| Offices of Physicians | 1,800 | 0.07 | $41.62 | $86,560 |
| Colleges, Universities, and Professional Schools | 1,231,630 | 40.80 | $39.03 | $81,180 |
States and areas with the highest published employment, location quotients, and wages for this occupation are provided. For a list of all areas with employment in this occupation, see the Create Customized Tables function.
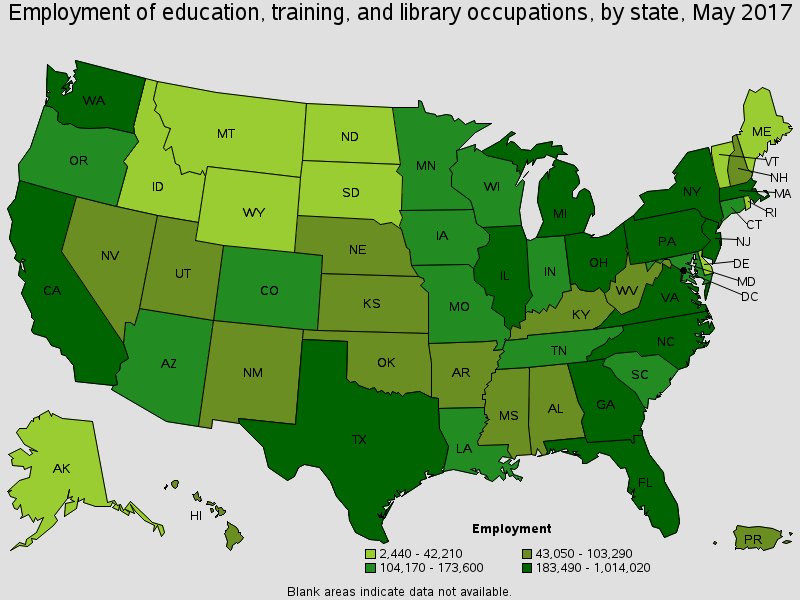
States with the highest employment level in this occupation:
| State | Employment (1) | Employment per thousand jobs | Location quotient (9) | Hourly mean wage | Annual mean wage (2) |
|---|---|---|---|---|---|
| California | 1,014,020 | 60.74 | 0.99 | $30.59 | $63,620 |
| Texas | 756,500 | 63.62 | 1.04 | $24.77 | $51,520 |
| New York | 684,450 | 74.33 | 1.21 | $32.44 | $67,470 |
| Florida | 420,230 | 49.91 | 0.82 | $23.50 | $48,890 |
| Illinois | 376,650 | 63.54 | 1.04 | $27.41 | $57,010 |
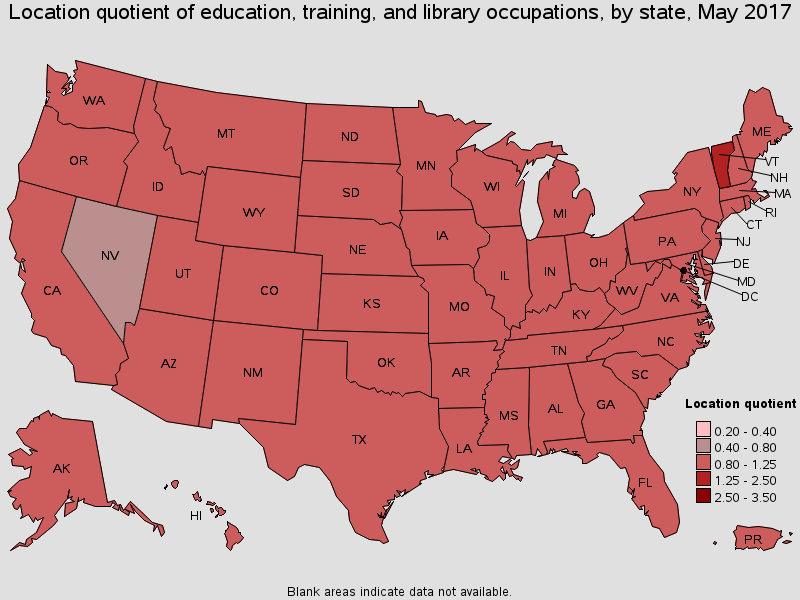
States with the highest concentration of jobs and location quotients in this occupation:
| State | Employment (1) | Employment per thousand jobs | Location quotient (9) | Hourly mean wage | Annual mean wage (2) |
|---|---|---|---|---|---|
| Vermont | 26,850 | 88.01 | 1.44 | $25.15 | $52,310 |
| Wyoming | 20,170 | 75.28 | 1.23 | $23.34 | $48,540 |
| New Jersey | 299,950 | 74.85 | 1.22 | $28.77 | $59,840 |
| New York | 684,450 | 74.33 | 1.21 | $32.44 | $67,470 |
| Connecticut | 118,370 | 71.55 | 1.17 | $31.16 | $64,810 |
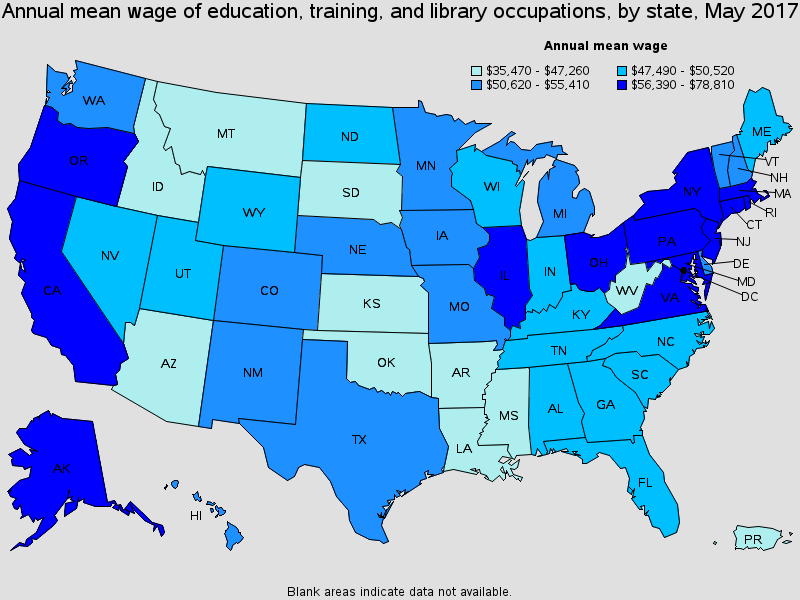
Top paying States for this occupation:
| State | Employment (1) | Employment per thousand jobs | Location quotient (9) | Hourly mean wage | Annual mean wage (2) |
|---|---|---|---|---|---|
| District of Columbia | 34,020 | 48.03 | 0.78 | $37.89 | $78,810 |
| New York | 684,450 | 74.33 | 1.21 | $32.44 | $67,470 |
| Massachusetts | 242,160 | 68.64 | 1.12 | $31.94 | $66,430 |
| Connecticut | 118,370 | 71.55 | 1.17 | $31.16 | $64,810 |
| Alaska | 21,860 | 68.71 | 1.12 | $30.66 | $63,780 |
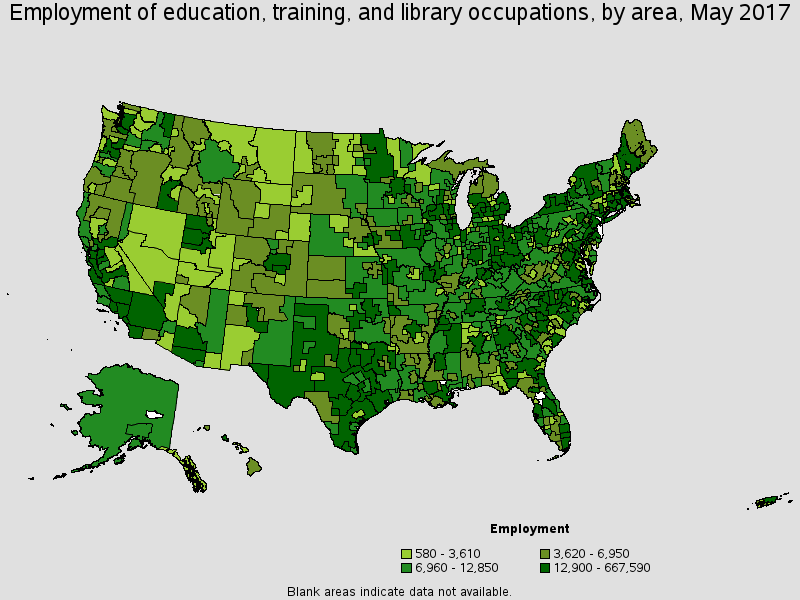
Metropolitan areas with the highest employment level in this occupation:
| Metropolitan area | Employment (1) | Employment per thousand jobs | Location quotient (9) | Hourly mean wage | Annual mean wage (2) |
|---|---|---|---|---|---|
| New York-Jersey City-White Plains, NY-NJ Metropolitan Division | 460,640 | 68.81 | 1.12 | $33.30 | $69,270 |
| Los Angeles-Long Beach-Glendale, CA Metropolitan Division | 258,360 | 58.31 | 0.95 | $32.43 | $67,450 |
| Chicago-Naperville-Arlington Heights, IL Metropolitan Division | 221,270 | 60.42 | 0.99 | $28.77 | $59,840 |
| Houston-The Woodlands-Sugar Land, TX | 177,660 | 60.65 | 0.99 | $27.65 | $57,510 |
| Washington-Arlington-Alexandria, DC-VA-MD-WV Metropolitan Division | 158,060 | 62.74 | 1.02 | $31.93 | $66,410 |
| Atlanta-Sandy Springs-Roswell, GA | 154,190 | 58.86 | 0.96 | $24.14 | $50,200 |
| Dallas-Plano-Irving, TX Metropolitan Division | 129,740 | 52.07 | 0.85 | $25.76 | $53,570 |
| Boston-Cambridge-Newton, MA NECTA Division | 118,410 | 64.36 | 1.05 | $33.91 | $70,540 |
| Minneapolis-St. Paul-Bloomington, MN-WI | 107,460 | 55.61 | 0.91 | $27.48 | $57,150 |
| Nassau County-Suffolk County, NY Metropolitan Division | 101,440 | 77.84 | 1.27 | $33.98 | $70,680 |
Metropolitan areas with the highest concentration of jobs and location quotients in this occupation:
| Metropolitan area | Employment (1) | Employment per thousand jobs | Location quotient (9) | Hourly mean wage | Annual mean wage (2) |
|---|---|---|---|---|---|
| Ithaca, NY | 8,220 | 164.02 | 2.68 | $44.89 | $93,370 |
| Gainesville, FL | 16,320 | 123.78 | 2.02 | $25.86 | $53,790 |
| Corvallis, OR | 4,440 | 122.49 | 2.00 | $29.39 | $61,130 |
| Ann Arbor, MI | 25,470 | 119.03 | 1.94 | (8) | (8) |
| Hinesville, GA | 1,960 | 112.92 | 1.84 | $20.85 | $43,360 |
| Blacksburg-Christiansburg-Radford, VA | 7,670 | 110.61 | 1.81 | (8) | (8) |
| College Station-Bryan, TX | 12,300 | 110.07 | 1.80 | $33.26 | $69,190 |
| Lawrence, KS | 5,330 | 107.56 | 1.76 | $28.58 | $59,440 |
| Merced, CA | 7,420 | 107.21 | 1.75 | $28.65 | $59,600 |
| Durham-Chapel Hill, NC | 31,900 | 106.87 | 1.75 | $38.75 | $80,600 |
Top paying metropolitan areas for this occupation:
| Metropolitan area | Employment (1) | Employment per thousand jobs | Location quotient (9) | Hourly mean wage | Annual mean wage (2) |
|---|---|---|---|---|---|
| Ithaca, NY | 8,220 | 164.02 | 2.68 | $44.89 | $93,370 |
| Durham-Chapel Hill, NC | 31,900 | 106.87 | 1.75 | $38.75 | $80,600 |
| Iowa City, IA | 8,510 | 92.47 | 1.51 | $38.52 | $80,120 |
| Auburn-Opelika, AL | 4,780 | 84.76 | 1.38 | $35.57 | $73,970 |
| Fairbanks, AK | (8) | (8) | (8) | $35.50 | $73,840 |
| San Francisco-Redwood City-South San Francisco, CA Metropolitan Division | 44,140 | 39.54 | 0.65 | $34.97 | $72,740 |
| Columbia, MO | 6,610 | 71.16 | 1.16 | $34.96 | $72,720 |
| Hagerstown-Martinsburg, MD-WV | 6,010 | 58.55 | 0.96 | $34.49 | $71,740 |
| Athens-Clarke County, GA | 8,100 | 94.06 | 1.54 | $34.25 | $71,240 |
| Nassau County-Suffolk County, NY Metropolitan Division | 101,440 | 77.84 | 1.27 | $33.98 | $70,680 |
Nonmetropolitan areas with the highest employment in this occupation:
| Nonmetropolitan area | Employment (1) | Employment per thousand jobs | Location quotient (9) | Hourly mean wage | Annual mean wage (2) |
|---|---|---|---|---|---|
| North Texas Region of Texas nonmetropolitan area | 22,210 | 82.45 | 1.35 | $20.85 | $43,370 |
| North Northeastern Ohio non-metropolitan area (non-contiguous) | 20,560 | 61.96 | 1.01 | $25.89 | $53,850 |
| Balance of Lower Peninsula of Michigan nonmetropolitan area | 19,690 | 70.77 | 1.16 | $23.94 | $49,790 |
| Southeast Coastal North Carolina nonmetropolitan area | 18,860 | 76.19 | 1.24 | $19.64 | $40,850 |
| Piedmont North Carolina nonmetropolitan area | 18,430 | 71.85 | 1.17 | $19.36 | $40,260 |
Nonmetropolitan areas with the highest concentration of jobs and location quotients in this occupation:
| Nonmetropolitan area | Employment (1) | Employment per thousand jobs | Location quotient (9) | Hourly mean wage | Annual mean wage (2) |
|---|---|---|---|---|---|
| Northwest Massachusetts nonmetropolitan area | 3,290 | 119.99 | 1.96 | $28.80 | $59,890 |
| East Washington nonmetropolitan area | 7,000 | 116.56 | 1.90 | $24.51 | $50,980 |
| Central Utah nonmetropolitan area | 2,180 | 105.34 | 1.72 | $20.83 | $43,320 |
| Central-Southeast Wyoming nonmetropolitan area | 3,810 | 105.16 | 1.72 | $26.65 | $55,430 |
| Central New York nonmetropolitan area | 12,840 | 102.05 | 1.67 | $24.08 | $50,080 |
Top paying nonmetropolitan areas for this occupation:
| Nonmetropolitan area | Employment (1) | Employment per thousand jobs | Location quotient (9) | Hourly mean wage | Annual mean wage (2) |
|---|---|---|---|---|---|
| West Central New Hampshire nonmetropolitan area | 5,570 | 86.20 | 1.41 | $32.90 | $68,440 |
| Connecticut nonmetropolitan area | 3,000 | 91.79 | 1.50 | $30.81 | $64,080 |
| Southeast Alaska nonmetropolitan area | 2,460 | 70.30 | 1.15 | $30.67 | $63,800 |
| Nantucket Island and Martha's Vineyard nonmetropolitan area | 1,170 | 65.23 | 1.07 | $30.64 | $63,740 |
| Northwest Massachusetts nonmetropolitan area | 3,290 | 119.99 | 1.96 | $28.80 | $59,890 |
These estimates are calculated with data collected from employers in all industry sectors, all metropolitan and nonmetropolitan areas, and all states and the District of Columbia.
The percentile wage estimate is the value of a wage below which a certain percent of workers fall. The median wage is the 50th percentile wage estimate--50 percent of workers earn less than the median and 50 percent of workers earn more than the median. More about percentile wages.
(1) Estimates for detailed occupations do not sum to the totals because the totals include occupations not shown separately. Estimates do not include self-employed workers.
(2) Annual wages have been calculated by multiplying the hourly mean wage by a "year-round, full-time" hours figure of 2,080 hours; for those occupations where there is not an hourly wage published, the annual wage has been directly calculated from the reported survey data.
(3) The relative standard error (RSE) is a measure of the reliability of a survey statistic. The smaller the relative standard error, the more precise the estimate.
(8) Estimate not released.
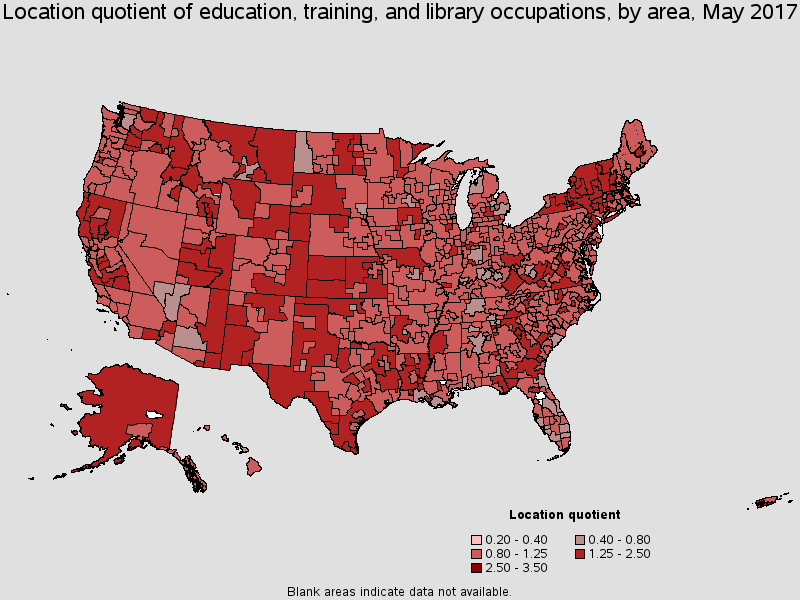
(9) The location quotient is the ratio of the area concentration of occupational employment to the national average concentration. A location quotient greater than one indicates the occupation has a higher share of employment than average, and a location quotient less than one indicates the occupation is less prevalent in the area than average.
Other OES estimates and related information:
May 2017 National Occupational Employment and Wage Estimates
May 2017 State Occupational Employment and Wage Estimates
May 2017 Metropolitan and Nonmetropolitan Area Occupational Employment and Wage Estimates
May 2017 National Industry-Specific Occupational Employment and Wage Estimates
Last Modified Date: March 30, 2018