
An official website of the United States government
An official website of the United States government
The .gov means it's official.
Federal government websites often end in .gov or .mil. Before sharing sensitive information,
make sure you're on a federal government site.
The site is secure.
The
https:// ensures that you are connecting to the official website and that any
information you provide is encrypted and transmitted securely.
Personal Care and Service Occupations comprises the following occupations: First-Line Supervisors of Gambling Services Workers; First-Line Supervisors of Entertainment and Recreation Workers, Except Gambling Services; First-Line Supervisors of Personal Service Workers; Animal Trainers; Animal Caretakers; Gambling Service Workers, All Other; Gambling and Sports Book Writers and Runners; Gambling Dealers; Motion Picture Projectionists; Ushers, Lobby Attendants, and Ticket Takers; Entertainment Attendants and Related Workers, All Other; Costume Attendants; Locker Room, Coatroom, and Dressing Room Attendants; Amusement and Recreation Attendants; Crematory Operators; Embalmers; Funeral Attendants; Morticians, Undertakers, and Funeral Arrangers; Barbers; Hairdressers, Hairstylists, and Cosmetologists; Makeup Artists, Theatrical and Performance; Shampooers; Skincare Specialists; Manicurists and Pedicurists; Baggage Porters and Bellhops; Concierges; Tour and Travel Guides; Childcare Workers; Exercise Trainers and Group Fitness Instructors; Recreation Workers; Residential Advisors; Personal Care and Service Workers, All Other
Employment estimate and mean wage estimates for Personal Care and Service Occupations:
| Employment (1) | Employment RSE (3) |
Mean hourly wage |
Mean annual wage (2) |
Wage RSE (3) |
|---|---|---|---|---|
| 2,566,440 | 0.6 % | $ 16.17 | $ 33,620 | 0.5 % |
Percentile wage estimates for Personal Care and Service Occupations:
| Percentile | 10% | 25% | 50% (Median) |
75% | 90% |
|---|---|---|---|---|---|
| Hourly Wage | $ 9.52 | $ 11.33 | $ 14.16 | $ 18.05 | $ 23.76 |
| Annual Wage (2) | $ 19,810 | $ 23,560 | $ 29,450 | $ 37,540 | $ 49,410 |
Industries with the highest published employment and wages for Personal Care and Service Occupations are provided. For a list of all industries with employment in Personal Care and Service Occupations, see the Create Customized Tables function.
Industries with the highest levels of employment in Personal Care and Service Occupations:
| Industry | Employment (1) | Percent of industry employment | Hourly mean wage | Annual mean wage (2) |
|---|---|---|---|---|
| Personal Care Services | 464,820 | 71.41 | $ 16.83 | $ 35,000 |
| Other Amusement and Recreation Industries | 374,590 | 33.71 | $ 17.30 | $ 35,970 |
| Child Day Care Services | 249,870 | 31.05 | $ 12.72 | $ 26,450 |
| Local Government, excluding schools and hospitals (OEWS Designation) | 167,980 | 3.13 | $ 16.56 | $ 34,450 |
| Other Personal Services | 135,760 | 45.72 | $ 15.13 | $ 31,470 |
Industries with the highest concentration of employment in Personal Care and Service Occupations:
| Industry | Employment (1) | Percent of industry employment | Hourly mean wage | Annual mean wage (2) |
|---|---|---|---|---|
| Personal Care Services | 464,820 | 71.41 | $ 16.83 | $ 35,000 |
| Death Care Services | 63,470 | 47.99 | $ 20.51 | $ 42,650 |
| Other Personal Services | 135,760 | 45.72 | $ 15.13 | $ 31,470 |
| Amusement Parks and Arcades | 60,180 | 39.24 | $ 13.00 | $ 27,050 |
| Other Amusement and Recreation Industries | 374,590 | 33.71 | $ 17.30 | $ 35,970 |
Top paying industries for Personal Care and Service Occupations:
| Industry | Employment (1) | Percent of industry employment | Hourly mean wage | Annual mean wage (2) |
|---|---|---|---|---|
| Other Information Services | 100 | 0.03 | $ 37.41 | $ 77,800 |
| Radio and Television Broadcasting | 280 | 0.15 | $ 36.01 | $ 74,890 |
| Newspaper, Periodical, Book, and Directory Publishers | 50 | 0.02 | $ 35.76 | $ 74,370 |
| Securities, Commodity Contracts, and Other Financial Investments and Related Activities | 120 | 0.01 | $ 28.17 | $ 58,590 |
| Chemical Manufacturing (3255 and 3256 only) | (8) | (8) | $ 26.30 | $ 54,700 |
States and areas with the highest published employment, location quotients, and wages for Personal Care and Service Occupations are provided. For a list of all areas with employment in Personal Care and Service Occupations, see the Create Customized Tables function.
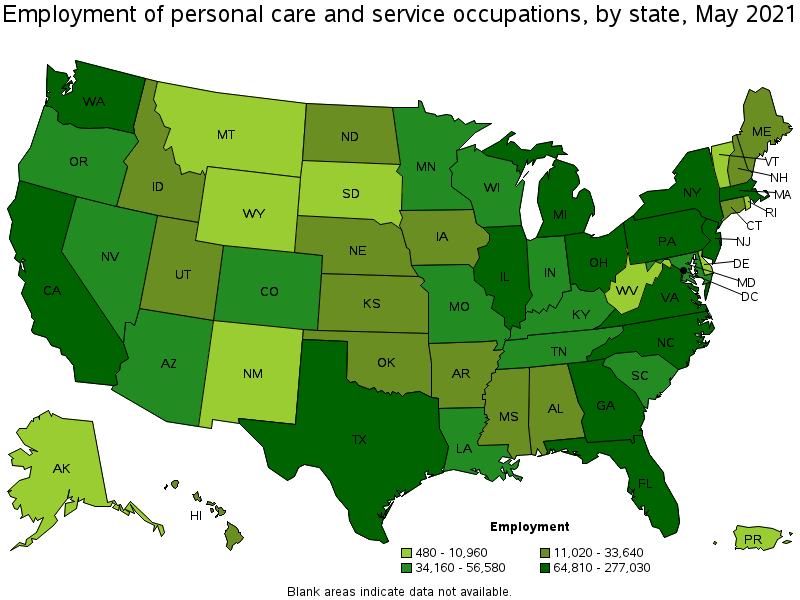
States with the highest employment level in Personal Care and Service Occupations:
| State | Employment (1) | Employment per thousand jobs | Location quotient (9) | Hourly mean wage | Annual mean wage (2) |
|---|---|---|---|---|---|
| California | 277,030 | 16.76 | 0.92 | $ 18.82 | $ 39,140 |
| Texas | 192,140 | 15.72 | 0.86 | $ 14.06 | $ 29,250 |
| Florida | 180,080 | 20.93 | 1.15 | $ 15.00 | $ 31,190 |
| New York | 168,690 | 19.46 | 1.07 | $ 19.27 | $ 40,070 |
| Pennsylvania | 109,450 | 19.60 | 1.08 | $ 15.04 | $ 31,280 |
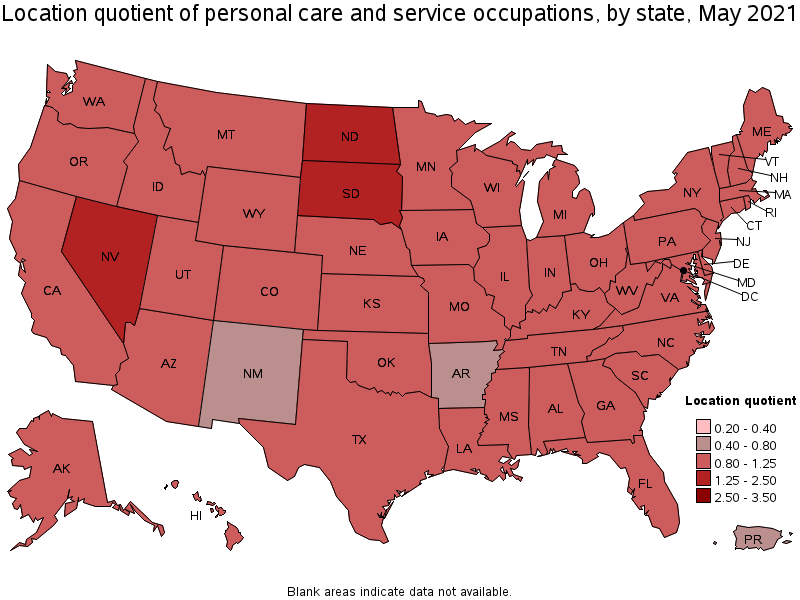
States with the highest concentration of jobs and location quotients in Personal Care and Service Occupations:
| State | Employment (1) | Employment per thousand jobs | Location quotient (9) | Hourly mean wage | Annual mean wage (2) |
|---|---|---|---|---|---|
| Nevada | 46,350 | 35.95 | 1.97 | $ 13.54 | $ 28,170 |
| North Dakota | 11,020 | 27.89 | 1.53 | $ 14.65 | $ 30,460 |
| South Dakota | 10,840 | 25.73 | 1.41 | $ 13.92 | $ 28,950 |
| Oregon | 41,060 | 22.49 | 1.23 | $ 16.94 | $ 35,240 |
| Maryland | 55,620 | 21.85 | 1.20 | $ 16.90 | $ 35,150 |
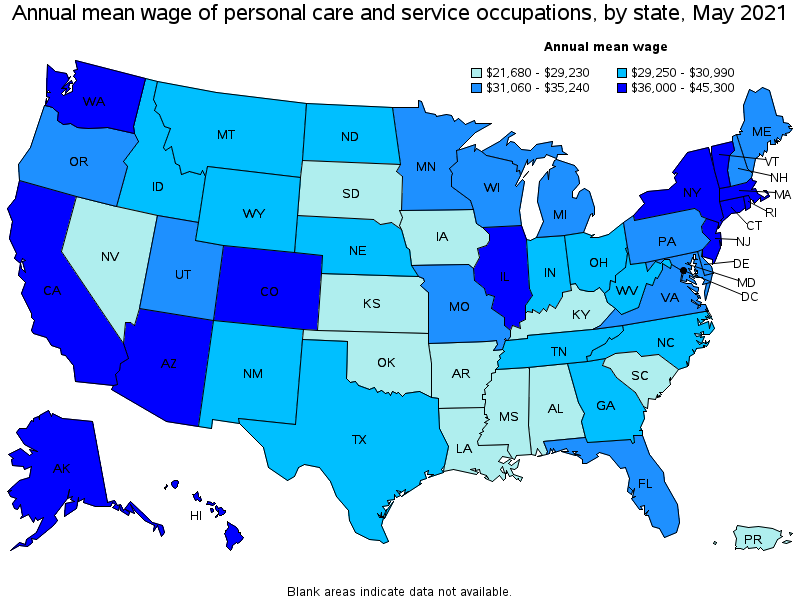
Top paying states for Personal Care and Service Occupations:
| State | Employment (1) | Employment per thousand jobs | Location quotient (9) | Hourly mean wage | Annual mean wage (2) |
|---|---|---|---|---|---|
| District of Columbia | 7,200 | 10.87 | 0.60 | $ 21.78 | $ 45,300 |
| Massachusetts | 64,810 | 19.09 | 1.05 | $ 19.70 | $ 40,970 |
| Washington | 66,530 | 20.75 | 1.14 | $ 19.31 | $ 40,160 |
| New York | 168,690 | 19.46 | 1.07 | $ 19.27 | $ 40,070 |
| California | 277,030 | 16.76 | 0.92 | $ 18.82 | $ 39,140 |
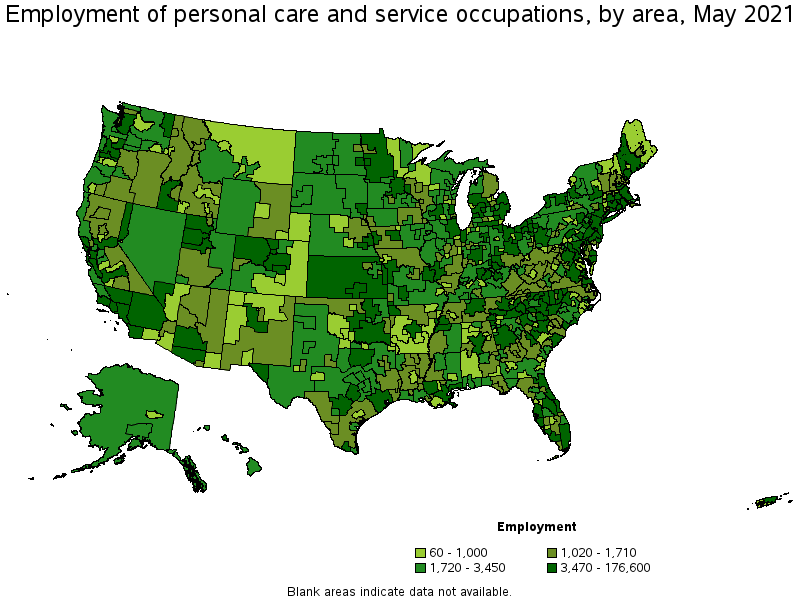
Metropolitan areas with the highest employment level in Personal Care and Service Occupations:
| Metropolitan area | Employment (1) | Employment per thousand jobs | Location quotient (9) | Hourly mean wage | Annual mean wage (2) |
|---|---|---|---|---|---|
| New York-Newark-Jersey City, NY-NJ-PA | 176,600 | 20.35 | 1.12 | $ 19.46 | $ 40,470 |
| Los Angeles-Long Beach-Anaheim, CA | 97,990 | 17.13 | 0.94 | $ 18.72 | $ 38,940 |
| Chicago-Naperville-Elgin, IL-IN-WI | 75,250 | 17.78 | 0.98 | $ 17.79 | $ 36,990 |
| Philadelphia-Camden-Wilmington, PA-NJ-DE-MD | 56,470 | 21.27 | 1.17 | $ 16.14 | $ 33,560 |
| Dallas-Fort Worth-Arlington, TX | 56,200 | 15.66 | 0.86 | $ 14.79 | $ 30,760 |
| Washington-Arlington-Alexandria, DC-VA-MD-WV | 55,010 | 18.76 | 1.03 | $ 18.37 | $ 38,210 |
| Miami-Fort Lauderdale-West Palm Beach, FL | 50,830 | 20.73 | 1.14 | $ 15.46 | $ 32,150 |
| Boston-Cambridge-Nashua, MA-NH | 50,060 | 19.37 | 1.06 | $ 19.77 | $ 41,120 |
| Houston-The Woodlands-Sugar Land, TX | 44,410 | 15.33 | 0.84 | $ 14.36 | $ 29,860 |
| Atlanta-Sandy Springs-Roswell, GA | 41,190 | 15.92 | 0.87 | $ 15.34 | $ 31,910 |
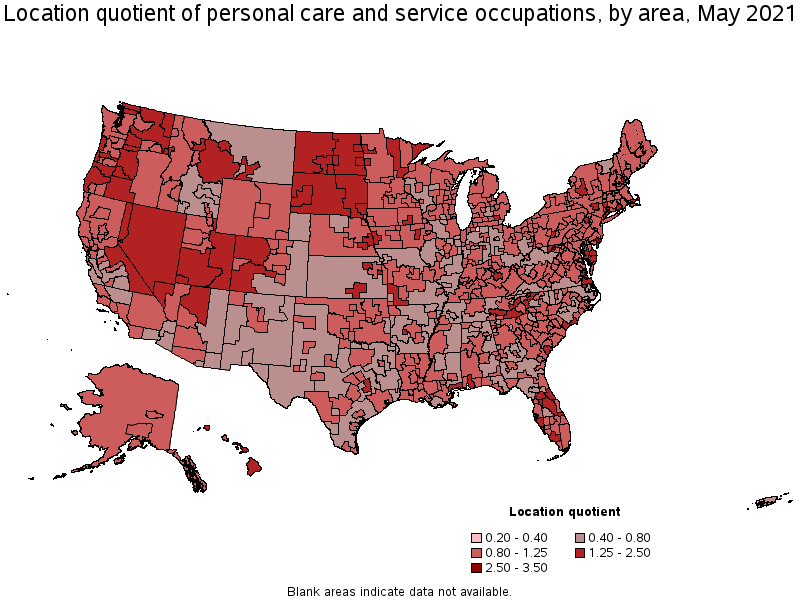
Metropolitan areas with the highest concentration of jobs and location quotients in Personal Care and Service Occupations:
| Metropolitan area | Employment (1) | Employment per thousand jobs | Location quotient (9) | Hourly mean wage | Annual mean wage (2) |
|---|---|---|---|---|---|
| Atlantic City-Hammonton, NJ | 6,710 | 57.80 | 3.17 | $ 17.72 | $ 36,850 |
| Las Vegas-Henderson-Paradise, NV | 36,830 | 40.10 | 2.20 | $ 13.54 | $ 28,170 |
| Ocean City, NJ | 1,450 | 37.08 | 2.04 | $ 17.31 | $ 35,990 |
| Hilton Head Island-Bluffton-Beaufort, SC | 2,760 | 36.92 | 2.03 | $ 14.41 | $ 29,980 |
| Norwich-New London-Westerly, CT-RI | 4,250 | 36.90 | 2.03 | $ 17.84 | $ 37,120 |
| Yakima, WA | 3,350 | 36.75 | 2.02 | $ 15.66 | $ 32,580 |
| East Stroudsburg, PA | 1,770 | 33.40 | 1.83 | $ 14.31 | $ 29,750 |
| Gulfport-Biloxi-Pascagoula, MS | 4,770 | 32.77 | 1.80 | $ 12.76 | $ 26,540 |
| Orlando-Kissimmee-Sanford, FL | 38,140 | 32.50 | 1.78 | $ 13.92 | $ 28,940 |
| Spokane-Spokane Valley, WA | 7,350 | 31.24 | 1.71 | $ 16.53 | $ 34,380 |
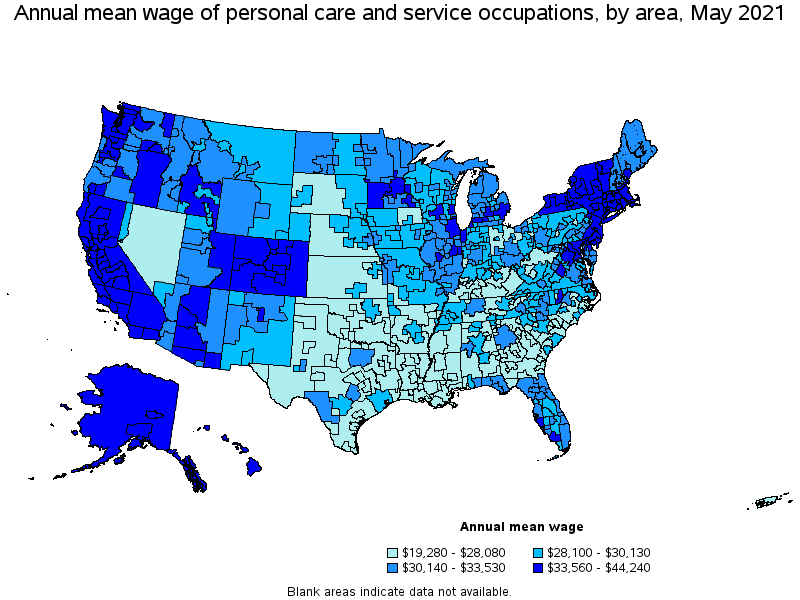
Top paying metropolitan areas for Personal Care and Service Occupations:
| Metropolitan area | Employment (1) | Employment per thousand jobs | Location quotient (9) | Hourly mean wage | Annual mean wage (2) |
|---|---|---|---|---|---|
| San Jose-Sunnyvale-Santa Clara, CA | 13,860 | 12.97 | 0.71 | $ 21.27 | $ 44,240 |
| San Francisco-Oakland-Hayward, CA | 36,990 | 16.50 | 0.91 | $ 21.15 | $ 43,990 |
| Seattle-Tacoma-Bellevue, WA | 35,760 | 18.65 | 1.02 | $ 20.94 | $ 43,560 |
| Barnstable Town, MA | 2,200 | 22.69 | 1.25 | $ 20.65 | $ 42,950 |
| Olympia-Tumwater, WA | 2,360 | 21.03 | 1.15 | $ 19.85 | $ 41,280 |
| Boston-Cambridge-Nashua, MA-NH | 50,060 | 19.37 | 1.06 | $ 19.77 | $ 41,120 |
| Bridgeport-Stamford-Norwalk, CT | 9,740 | 25.98 | 1.43 | $ 19.53 | $ 40,620 |
| Boulder, CO | 3,980 | 21.87 | 1.20 | $ 19.48 | $ 40,520 |
| New York-Newark-Jersey City, NY-NJ-PA | 176,600 | 20.35 | 1.12 | $ 19.46 | $ 40,470 |
| Bremerton-Silverdale, WA | 1,610 | 18.70 | 1.03 | $ 19.45 | $ 40,450 |
Nonmetropolitan areas with the highest employment in Personal Care and Service Occupations:
| Nonmetropolitan area | Employment (1) | Employment per thousand jobs | Location quotient (9) | Hourly mean wage | Annual mean wage (2) |
|---|---|---|---|---|---|
| Kansas nonmetropolitan area | 5,360 | 14.27 | 0.78 | $ 13.05 | $ 27,140 |
| North Northeastern Ohio nonmetropolitan area (noncontiguous) | 4,800 | 15.26 | 0.84 | $ 13.12 | $ 27,290 |
| Balance of Lower Peninsula of Michigan nonmetropolitan area | 4,180 | 16.55 | 0.91 | $ 15.73 | $ 32,720 |
| Northwest Colorado nonmetropolitan area | 4,050 | 34.66 | 1.90 | $ 19.41 | $ 40,370 |
| Piedmont North Carolina nonmetropolitan area | 3,860 | 15.79 | 0.87 | $ 13.60 | $ 28,290 |
Nonmetropolitan areas with the highest concentration of jobs and location quotients in Personal Care and Service Occupations:
| Nonmetropolitan area | Employment (1) | Employment per thousand jobs | Location quotient (9) | Hourly mean wage | Annual mean wage (2) |
|---|---|---|---|---|---|
| Northwest Colorado nonmetropolitan area | 4,050 | 34.66 | 1.90 | $ 19.41 | $ 40,370 |
| Southwest Missouri nonmetropolitan area | 2,190 | 31.10 | 1.71 | $ 13.08 | $ 27,210 |
| West South Dakota nonmetropolitan area | 1,860 | 31.10 | 1.71 | $ 13.49 | $ 28,060 |
| Eastern Utah nonmetropolitan area | 2,440 | 30.60 | 1.68 | $ 16.17 | $ 33,640 |
| East North Dakota nonmetropolitan area | 1,860 | 30.56 | 1.68 | $ 13.81 | $ 28,730 |
Top paying nonmetropolitan areas for Personal Care and Service Occupations:
| Nonmetropolitan area | Employment (1) | Employment per thousand jobs | Location quotient (9) | Hourly mean wage | Annual mean wage (2) |
|---|---|---|---|---|---|
| Massachusetts nonmetropolitan area | 1,150 | 19.91 | 1.09 | $ 19.99 | $ 41,570 |
| Northwest Colorado nonmetropolitan area | 4,050 | 34.66 | 1.90 | $ 19.41 | $ 40,370 |
| Alaska nonmetropolitan area | 1,850 | 19.05 | 1.05 | $ 18.80 | $ 39,100 |
| Southwest Colorado nonmetropolitan area | 2,300 | 23.21 | 1.27 | $ 18.01 | $ 37,460 |
| Western Washington nonmetropolitan area | 2,360 | 19.75 | 1.08 | $ 17.95 | $ 37,340 |
These estimates are calculated with data collected from employers in all industry sectors, all metropolitan and nonmetropolitan areas, and all states and the District of Columbia.
The percentile wage estimate is the value of a wage below which a certain percent of workers fall. The median wage is the 50th percentile wage estimate—50 percent of workers earn less than the median and 50 percent of workers earn more than the median. More about percentile wages.
(1) Estimates for detailed occupations do not sum to the totals because the totals include occupations not shown separately. Estimates do not include self-employed workers.
(2) Annual wages have been calculated by multiplying the hourly mean wage by a "year-round, full-time" hours figure of 2,080 hours; for those occupations where there is not an hourly wage published, the annual wage has been directly calculated from the reported survey data.
(3) The relative standard error (RSE) is a measure of the reliability of a survey statistic. The smaller the relative standard error, the more precise the estimate.
(8) Estimate not released.
(9) The location quotient is the ratio of the area concentration of occupational employment to the national average concentration. A location quotient greater than one indicates the occupation has a higher share of employment than average, and a location quotient less than one indicates the occupation is less prevalent in the area than average.
Other OEWS estimates and related information:
May 2021 National Occupational Employment and Wage Estimates
May 2021 State Occupational Employment and Wage Estimates
May 2021 Metropolitan and Nonmetropolitan Area Occupational Employment and Wage Estimates
May 2021 National Industry-Specific Occupational Employment and Wage Estimates
Last Modified Date: March 31, 2022