
An official website of the United States government
An official website of the United States government
The .gov means it's official.
Federal government websites often end in .gov or .mil. Before sharing sensitive information,
make sure you're on a federal government site.
The site is secure.
The
https:// ensures that you are connecting to the official website and that any
information you provide is encrypted and transmitted securely.
Construction and Extraction Occupations comprises the following occupations: First-Line Supervisors of Construction Trades and Extraction Workers; Boilermakers; Stonemasons; Brickmasons and Blockmasons; Carpenters; Floor Sanders and Finishers; Floor Layers, Except Carpet, Wood, and Hard Tiles; Carpet Installers; Tile and Stone Setters; Terrazzo Workers and Finishers; Cement Masons and Concrete Finishers; Construction Laborers; Pile Driver Operators; Paving, Surfacing, and Tamping Equipment Operators; Operating Engineers and Other Construction Equipment Operators; Tapers; Drywall and Ceiling Tile Installers; Electricians; Glaziers; Insulation Workers, Mechanical; Insulation Workers, Floor, Ceiling, and Wall; Paperhangers; Painters, Construction and Maintenance; Pipelayers; Plumbers, Pipefitters, and Steamfitters; Plasterers and Stucco Masons; Reinforcing Iron and Rebar Workers; Roofers; Sheet Metal Workers; Structural Iron and Steel Workers; Solar Photovoltaic Installers; Helpers, Construction Trades, All Other; Helpers--Roofers; Helpers--Painters, Paperhangers, Plasterers, and Stucco Masons; Helpers--Brickmasons, Blockmasons, Stonemasons, and Tile and Marble Setters; Helpers--Carpenters; Helpers--Pipelayers, Plumbers, Pipefitters, and Steamfitters; Helpers--Electricians; Construction and Building Inspectors; Elevator and Escalator Installers and Repairers; Fence Erectors; Hazardous Materials Removal Workers; Highway Maintenance Workers; Rail-Track Laying and Maintenance Equipment Operators; Septic Tank Servicers and Sewer Pipe Cleaners; Miscellaneous Construction and Related Workers; Derrick Operators, Oil and Gas; Rotary Drill Operators, Oil and Gas; Service Unit Operators, Oil and Gas; Earth Drillers, Except Oil and Gas; Excavating and Loading Machine and Dragline Operators, Surface Mining; Explosives Workers, Ordnance Handling Experts, and Blasters; Underground Mining Machine Operators, All Other; Roof Bolters, Mining; Loading and Moving Machine Operators, Underground Mining; Continuous Mining Machine Operators; Rock Splitters, Quarry; Roustabouts, Oil and Gas; Helpers--Extraction Workers; Extraction Workers, All Other
Employment estimate and mean wage estimates for Construction and Extraction Occupations:
| Employment (1) | Employment RSE (3) |
Mean hourly wage |
Mean annual wage (2) |
Wage RSE (3) |
|---|---|---|---|---|
| 5,848,950 | 0.2 % | $ 26.87 | $ 55,900 | 0.3 % |
Percentile wage estimates for Construction and Extraction Occupations:
| Percentile | 10% | 25% | 50% (Median) |
75% | 90% |
|---|---|---|---|---|---|
| Hourly Wage | $ 14.46 | $ 18.12 | $ 23.18 | $ 30.75 | $ 44.75 |
| Annual Wage (2) | $ 30,080 | $ 37,680 | $ 48,210 | $ 63,960 | $ 93,080 |
Industries with the highest published employment and wages for Construction and Extraction Occupations are provided. For a list of all industries with employment in Construction and Extraction Occupations, see the Create Customized Tables function.
Industries with the highest levels of employment in Construction and Extraction Occupations:
| Industry | Employment (1) | Percent of industry employment | Hourly mean wage | Annual mean wage (2) |
|---|---|---|---|---|
| Building Equipment Contractors | 1,194,240 | 53.22 | $ 29.85 | $ 62,080 |
| Foundation, Structure, and Building Exterior Contractors | 686,320 | 73.53 | $ 25.47 | $ 52,990 |
| Building Finishing Contractors | 581,970 | 71.92 | $ 24.99 | $ 51,980 |
| Residential Building Construction | 481,140 | 57.23 | $ 24.31 | $ 50,560 |
| Other Specialty Trade Contractors | 443,280 | 62.05 | $ 24.64 | $ 51,250 |
Industries with the highest concentration of employment in Construction and Extraction Occupations:
| Industry | Employment (1) | Percent of industry employment | Hourly mean wage | Annual mean wage (2) |
|---|---|---|---|---|
| Foundation, Structure, and Building Exterior Contractors | 686,320 | 73.53 | $ 25.47 | $ 52,990 |
| Building Finishing Contractors | 581,970 | 71.92 | $ 24.99 | $ 51,980 |
| Highway, Street, and Bridge Construction | 228,400 | 64.25 | $ 28.58 | $ 59,450 |
| Other Specialty Trade Contractors | 443,280 | 62.05 | $ 24.64 | $ 51,250 |
| Other Heavy and Civil Engineering Construction | 72,140 | 59.97 | $ 27.10 | $ 56,360 |
Top paying industries for Construction and Extraction Occupations:
| Industry | Employment (1) | Percent of industry employment | Hourly mean wage | Annual mean wage (2) |
|---|---|---|---|---|
| Scheduled Air Transportation | 670 | 0.17 | $ 45.61 | $ 94,880 |
| Insurance Carriers | 160 | 0.01 | $ 45.17 | $ 93,950 |
| Monetary Authorities-Central Bank | 70 | 0.31 | $ 43.38 | $ 90,230 |
| Pipeline Transportation of Crude Oil | 380 | 3.34 | $ 40.66 | $ 84,570 |
| Other Professional, Scientific, and Technical Services | 9,310 | 1.22 | $ 40.33 | $ 83,890 |
States and areas with the highest published employment, location quotients, and wages for Construction and Extraction Occupations are provided. For a list of all areas with employment in Construction and Extraction Occupations, see the Create Customized Tables function.
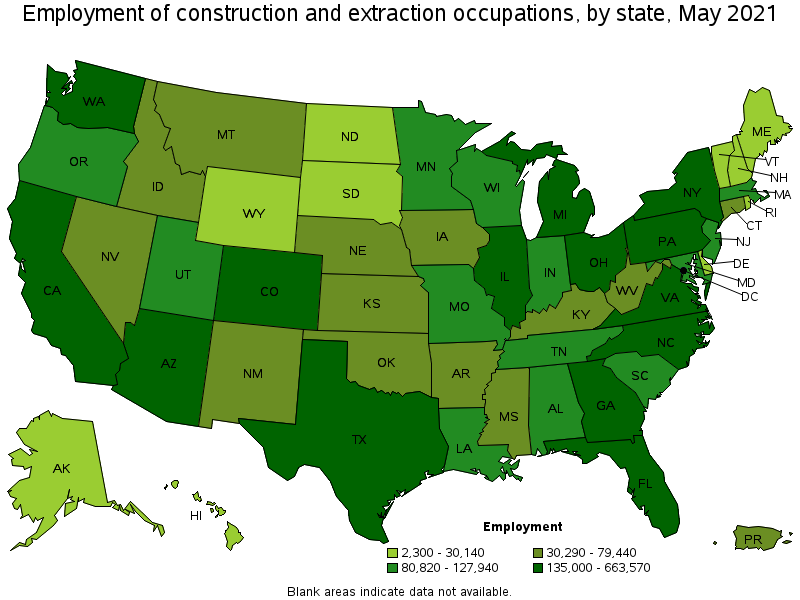
States with the highest employment level in Construction and Extraction Occupations:
| State | Employment (1) | Employment per thousand jobs | Location quotient (9) | Hourly mean wage | Annual mean wage (2) |
|---|---|---|---|---|---|
| California | 663,570 | 40.14 | 0.97 | $ 31.95 | $ 66,450 |
| Texas | 568,930 | 46.53 | 1.12 | $ 23.20 | $ 48,260 |
| Florida | 398,060 | 46.26 | 1.11 | $ 21.85 | $ 45,450 |
| New York | 311,160 | 35.89 | 0.86 | $ 33.69 | $ 70,070 |
| Pennsylvania | 214,610 | 38.44 | 0.93 | $ 27.34 | $ 56,870 |
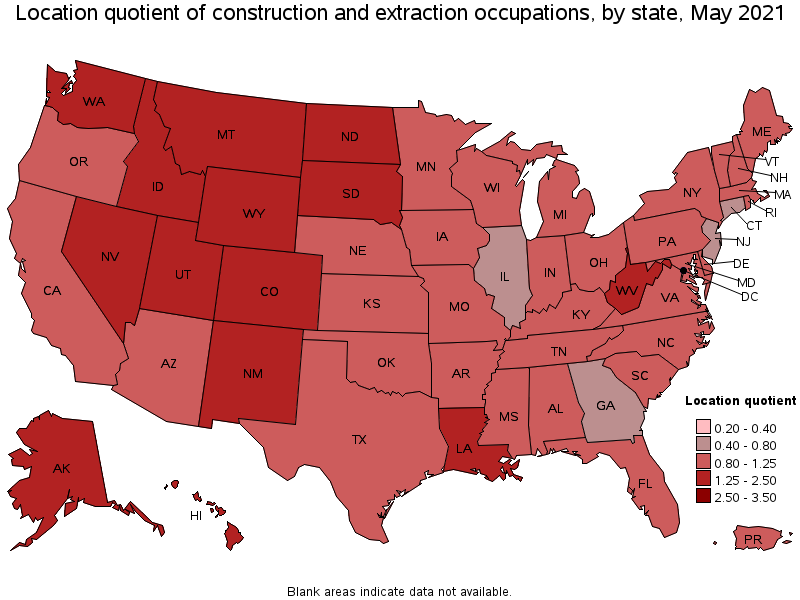
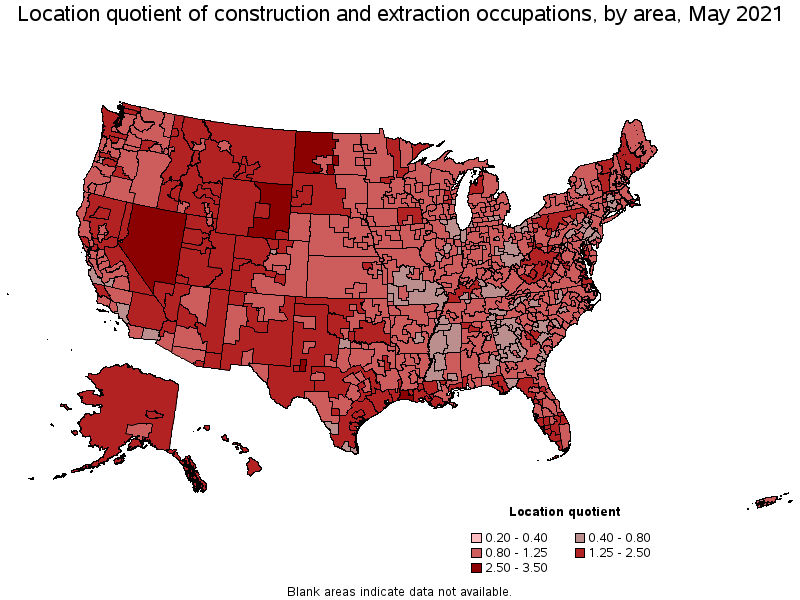
States with the highest concentration of jobs and location quotients in Construction and Extraction Occupations:
| State | Employment (1) | Employment per thousand jobs | Location quotient (9) | Hourly mean wage | Annual mean wage (2) |
|---|---|---|---|---|---|
| Wyoming | 23,190 | 89.00 | 2.14 | $ 27.05 | $ 56,260 |
| North Dakota | 28,000 | 70.87 | 1.71 | $ 27.69 | $ 57,600 |
| Montana | 30,290 | 64.42 | 1.55 | $ 25.83 | $ 53,720 |
| Utah | 98,140 | 63.12 | 1.52 | $ 23.87 | $ 49,650 |
| New Mexico | 48,430 | 62.37 | 1.50 | $ 23.00 | $ 47,830 |
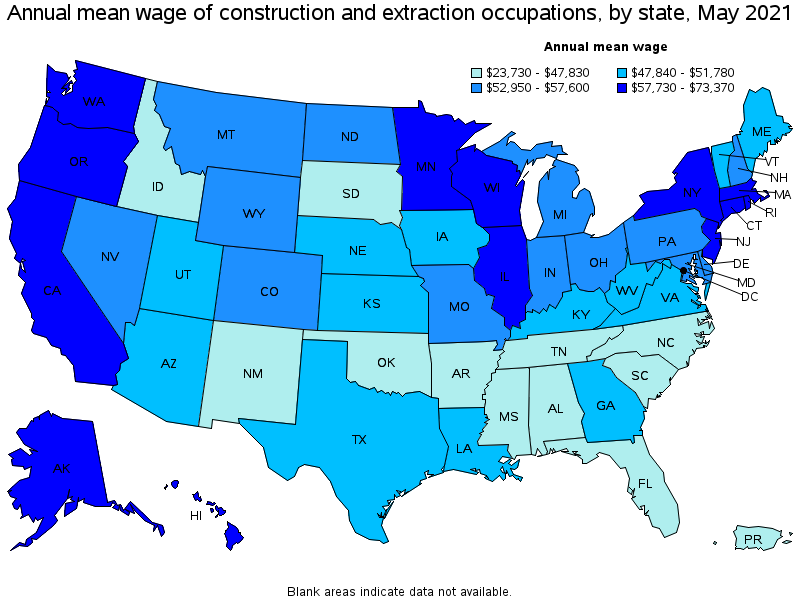
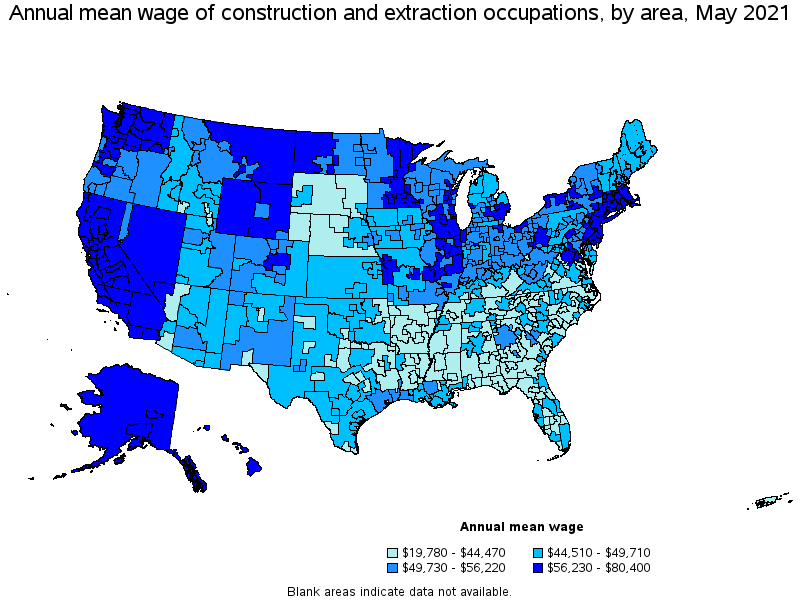
Top paying states for Construction and Extraction Occupations:
| State | Employment (1) | Employment per thousand jobs | Location quotient (9) | Hourly mean wage | Annual mean wage (2) |
|---|---|---|---|---|---|
| Hawaii | 30,140 | 54.97 | 1.32 | $ 35.27 | $ 73,370 |
| New Jersey | 116,040 | 30.14 | 0.73 | $ 34.47 | $ 71,710 |
| Alaska | 18,280 | 61.80 | 1.49 | $ 34.34 | $ 71,420 |
| Massachusetts | 127,940 | 37.69 | 0.91 | $ 34.27 | $ 71,290 |
| Illinois | 173,610 | 30.90 | 0.74 | $ 34.18 | $ 71,090 |
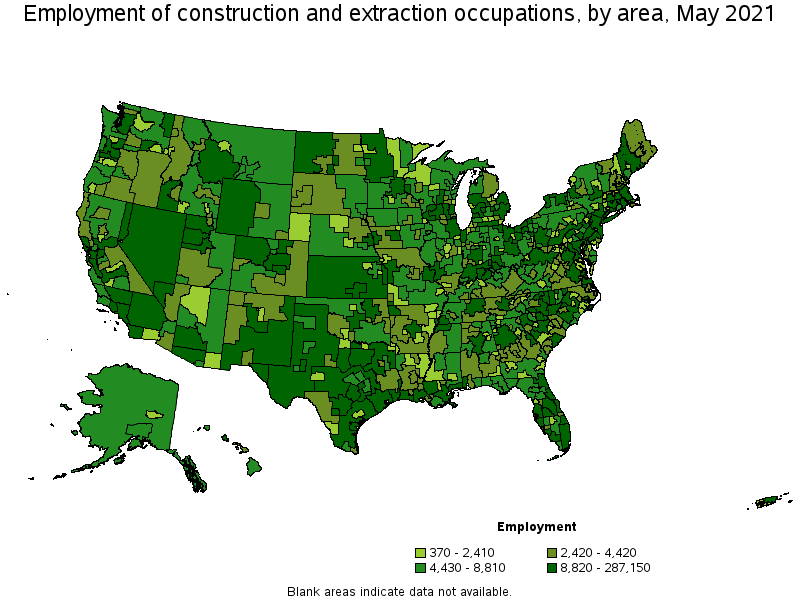
Metropolitan areas with the highest employment level in Construction and Extraction Occupations:
| Metropolitan area | Employment (1) | Employment per thousand jobs | Location quotient (9) | Hourly mean wage | Annual mean wage (2) |
|---|---|---|---|---|---|
| New York-Newark-Jersey City, NY-NJ-PA | 287,150 | 33.09 | 0.80 | $ 36.14 | $ 75,180 |
| Los Angeles-Long Beach-Anaheim, CA | 187,090 | 32.71 | 0.79 | $ 31.18 | $ 64,860 |
| Houston-The Woodlands-Sugar Land, TX | 154,290 | 53.26 | 1.28 | $ 24.86 | $ 51,710 |
| Dallas-Fort Worth-Arlington, TX | 141,800 | 39.51 | 0.95 | $ 23.22 | $ 48,290 |
| Chicago-Naperville-Elgin, IL-IN-WI | 124,910 | 29.51 | 0.71 | $ 35.84 | $ 74,550 |
| Washington-Arlington-Alexandria, DC-VA-MD-WV | 108,760 | 37.08 | 0.89 | $ 27.95 | $ 58,140 |
| Phoenix-Mesa-Scottsdale, AZ | 99,420 | 46.97 | 1.13 | $ 24.63 | $ 51,230 |
| Miami-Fort Lauderdale-West Palm Beach, FL | 94,980 | 38.73 | 0.93 | $ 23.42 | $ 48,700 |
| Boston-Cambridge-Nashua, MA-NH | 92,540 | 35.80 | 0.86 | $ 35.11 | $ 73,030 |
| Seattle-Tacoma-Bellevue, WA | 91,700 | 47.82 | 1.15 | $ 35.84 | $ 74,550 |
Metropolitan areas with the highest concentration of jobs and location quotients in Construction and Extraction Occupations:
| Metropolitan area | Employment (1) | Employment per thousand jobs | Location quotient (9) | Hourly mean wage | Annual mean wage (2) |
|---|---|---|---|---|---|
| Midland, TX | 11,980 | 125.93 | 3.03 | $ 26.61 | $ 55,360 |
| Lake Charles, LA | 9,840 | 109.02 | 2.63 | $ 24.20 | $ 50,330 |
| Odessa, TX | 6,780 | 101.49 | 2.44 | $ 24.29 | $ 50,530 |
| Greeley, CO | 9,690 | 95.15 | 2.29 | $ 25.42 | $ 52,880 |
| Farmington, NM | 3,840 | 93.09 | 2.24 | $ 25.50 | $ 53,040 |
| St. George, UT | 6,820 | 90.19 | 2.17 | $ 21.96 | $ 45,680 |
| Kennewick-Richland, WA | 9,760 | 83.41 | 2.01 | $ 32.31 | $ 67,210 |
| Cape Coral-Fort Myers, FL | 21,810 | 81.84 | 1.97 | $ 21.38 | $ 44,470 |
| Longview, TX | 7,250 | 80.58 | 1.94 | $ 21.73 | $ 45,200 |
| The Villages, FL | 2,660 | 79.52 | 1.92 | $ 20.24 | $ 42,110 |
Top paying metropolitan areas for Construction and Extraction Occupations:
| Metropolitan area | Employment (1) | Employment per thousand jobs | Location quotient (9) | Hourly mean wage | Annual mean wage (2) |
|---|---|---|---|---|---|
| San Jose-Sunnyvale-Santa Clara, CA | 37,740 | 35.32 | 0.85 | $ 38.66 | $ 80,400 |
| San Francisco-Oakland-Hayward, CA | 89,440 | 39.89 | 0.96 | $ 37.80 | $ 78,620 |
| New York-Newark-Jersey City, NY-NJ-PA | 287,150 | 33.09 | 0.80 | $ 36.14 | $ 75,180 |
| Urban Honolulu, HI | 21,860 | 55.33 | 1.33 | $ 36.06 | $ 75,000 |
| Chicago-Naperville-Elgin, IL-IN-WI | 124,910 | 29.51 | 0.71 | $ 35.84 | $ 74,550 |
| Seattle-Tacoma-Bellevue, WA | 91,700 | 47.82 | 1.15 | $ 35.84 | $ 74,550 |
| Boston-Cambridge-Nashua, MA-NH | 92,540 | 35.80 | 0.86 | $ 35.11 | $ 73,030 |
| Trenton, NJ | 4,430 | 19.49 | 0.47 | $ 34.85 | $ 72,500 |
| Fairbanks, AK | 2,410 | 70.03 | 1.69 | $ 34.65 | $ 72,070 |
| Anchorage, AK | 8,290 | 51.27 | 1.23 | $ 34.38 | $ 71,500 |
Nonmetropolitan areas with the highest employment in Construction and Extraction Occupations:
| Nonmetropolitan area | Employment (1) | Employment per thousand jobs | Location quotient (9) | Hourly mean wage | Annual mean wage (2) |
|---|---|---|---|---|---|
| Kansas nonmetropolitan area | 17,010 | 45.28 | 1.09 | $ 21.46 | $ 44,640 |
| North Northeastern Ohio nonmetropolitan area (noncontiguous) | 14,050 | 44.72 | 1.08 | $ 24.84 | $ 51,660 |
| West North Dakota nonmetropolitan area | 13,830 | 130.59 | 3.15 | $ 29.79 | $ 61,970 |
| Eastern New Mexico nonmetropolitan area | 13,690 | 93.86 | 2.26 | $ 24.46 | $ 50,880 |
| West Texas Region of Texas nonmetropolitan area | 13,680 | 74.25 | 1.79 | $ 23.90 | $ 49,710 |
Nonmetropolitan areas with the highest concentration of jobs and location quotients in Construction and Extraction Occupations:
| Nonmetropolitan area | Employment (1) | Employment per thousand jobs | Location quotient (9) | Hourly mean wage | Annual mean wage (2) |
|---|---|---|---|---|---|
| West North Dakota nonmetropolitan area | 13,830 | 130.59 | 3.15 | $ 29.79 | $ 61,970 |
| Nevada nonmetropolitan area | 11,030 | 113.91 | 2.74 | $ 27.68 | $ 57,580 |
| Eastern Wyoming nonmetropolitan area | 8,320 | 104.17 | 2.51 | $ 28.18 | $ 58,620 |
| Eastern New Mexico nonmetropolitan area | 13,690 | 93.86 | 2.26 | $ 24.46 | $ 50,880 |
| Western Wyoming nonmetropolitan area | 8,820 | 93.80 | 2.26 | $ 27.36 | $ 56,900 |
Top paying nonmetropolitan areas for Construction and Extraction Occupations:
| Nonmetropolitan area | Employment (1) | Employment per thousand jobs | Location quotient (9) | Hourly mean wage | Annual mean wage (2) |
|---|---|---|---|---|---|
| Alaska nonmetropolitan area | 7,410 | 76.13 | 1.83 | $ 34.28 | $ 71,310 |
| Hawaii / Kauai nonmetropolitan area | 4,850 | 54.53 | 1.31 | $ 32.51 | $ 67,620 |
| Massachusetts nonmetropolitan area | 3,040 | 52.65 | 1.27 | $ 30.20 | $ 62,820 |
| West North Dakota nonmetropolitan area | 13,830 | 130.59 | 3.15 | $ 29.79 | $ 61,970 |
| Northwest Illinois nonmetropolitan area | 5,280 | 41.79 | 1.01 | $ 29.44 | $ 61,240 |
These estimates are calculated with data collected from employers in all industry sectors, all metropolitan and nonmetropolitan areas, and all states and the District of Columbia.
The percentile wage estimate is the value of a wage below which a certain percent of workers fall. The median wage is the 50th percentile wage estimate—50 percent of workers earn less than the median and 50 percent of workers earn more than the median. More about percentile wages.
(1) Estimates for detailed occupations do not sum to the totals because the totals include occupations not shown separately. Estimates do not include self-employed workers.
(2) Annual wages have been calculated by multiplying the hourly mean wage by a "year-round, full-time" hours figure of 2,080 hours; for those occupations where there is not an hourly wage published, the annual wage has been directly calculated from the reported survey data.
(3) The relative standard error (RSE) is a measure of the reliability of a survey statistic. The smaller the relative standard error, the more precise the estimate.
(9) The location quotient is the ratio of the area concentration of occupational employment to the national average concentration. A location quotient greater than one indicates the occupation has a higher share of employment than average, and a location quotient less than one indicates the occupation is less prevalent in the area than average.
Other OEWS estimates and related information:
May 2021 National Occupational Employment and Wage Estimates
May 2021 State Occupational Employment and Wage Estimates
May 2021 Metropolitan and Nonmetropolitan Area Occupational Employment and Wage Estimates
May 2021 National Industry-Specific Occupational Employment and Wage Estimates
Last Modified Date: March 31, 2022