An official website of the United States government
 United States Department of Labor
This page compares the most recent set of industry projections evaluations with previous sets. This comparison is meant to give the reader an idea of how well the BLS method works over time. The projections evaluations covered are for 2008–2018, 2006–16, 2004–14, and 2002–12. For more information, refer to our evaluation methodology.
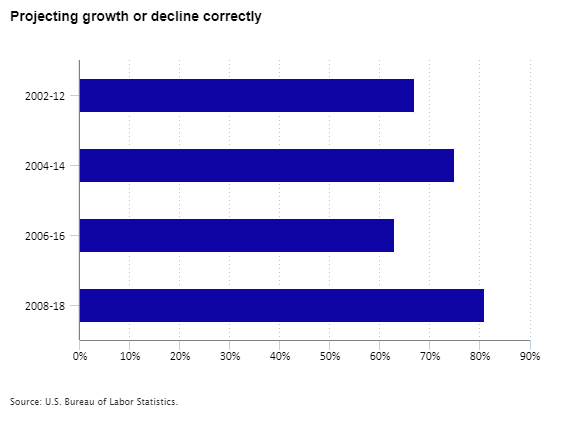
How often did BLS correctly project growth and decline for major sectors?
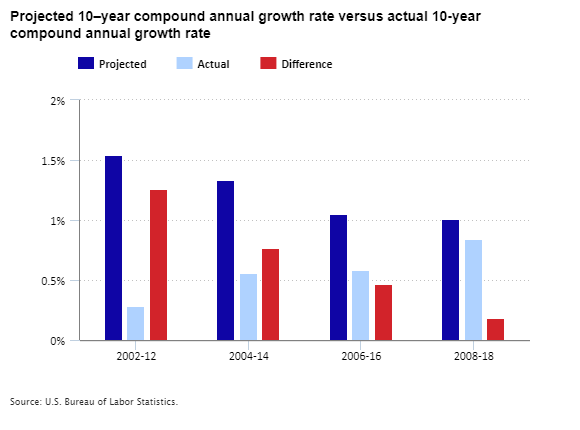
What was the difference between the projected 10–year compound annual growth rate and the actual compound annual growth rate?
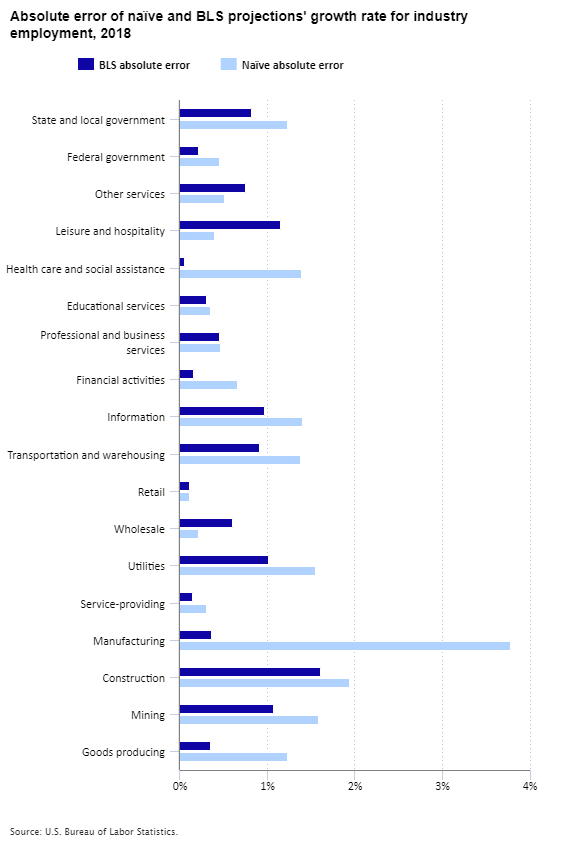
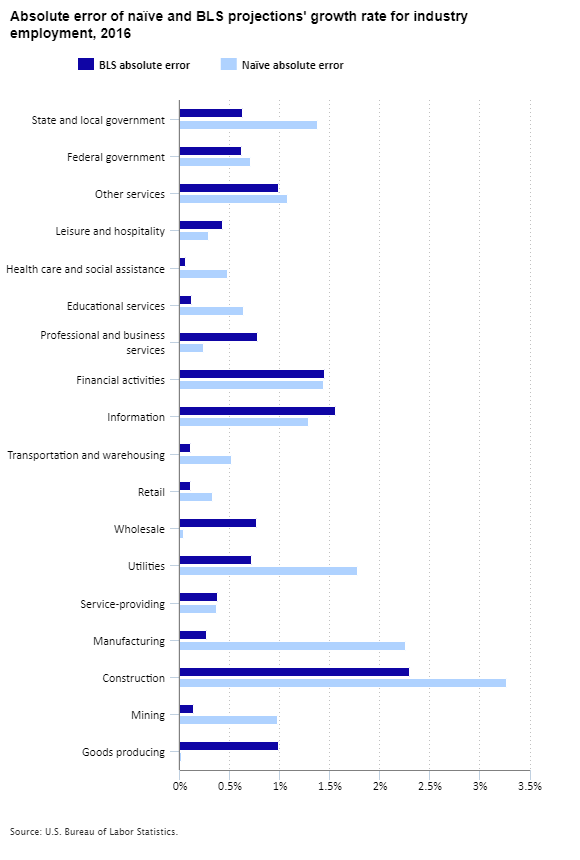
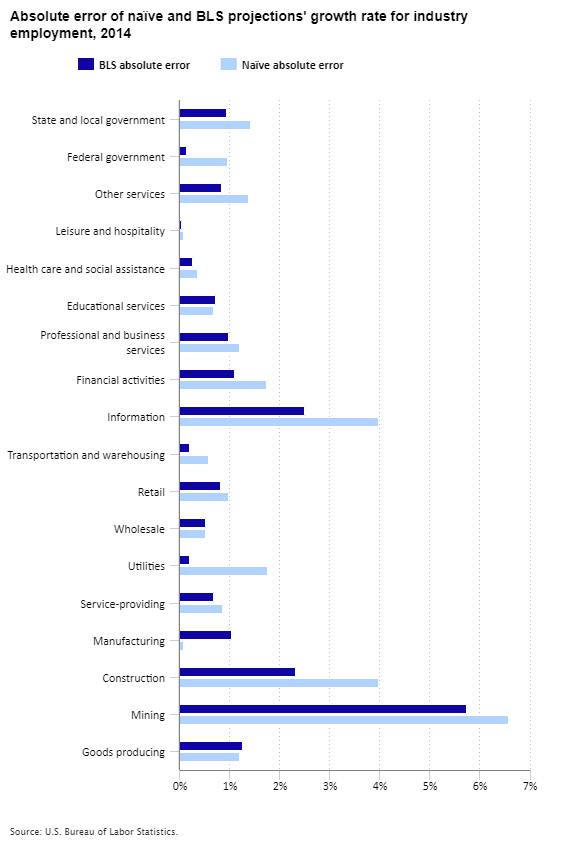
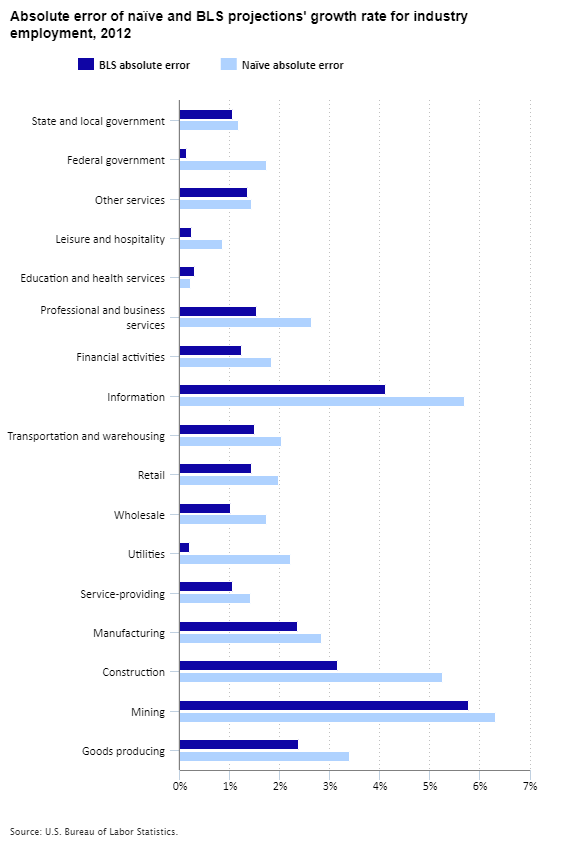
Projections of industry employment resulted in sizable errors for both the BLS and the naïve models.
In 2018, BLS’ compound annual growth rate was more accurate than the naïve model in all of the sectors, except for Other Services, Leisure and Hospitality, Retail Trade, and Wholesale Trade.
In 2016, BLS' compound annual growth rate was more accurate than the naïve model for eleven of the sixteen major sectors.
In 2014, BLS' compound annual growth rate was more accurate than the naïve model in all of the sectors, except for Manufacturing, Wholesale Trade, and Educational Services.
In 2012, BLS' compound annual growth rate was more accurate than the naïve model in all of the sectors, except for Education and Health Services.
Last Modified Date: March 16, 2020