
An official website of the United States government
An official website of the United States government
The .gov means it's official.
Federal government websites often end in .gov or .mil. Before sharing sensitive information,
make sure you're on a federal government site.
The site is secure.
The
https:// ensures that you are connecting to the official website and that any
information you provide is encrypted and transmitted securely.
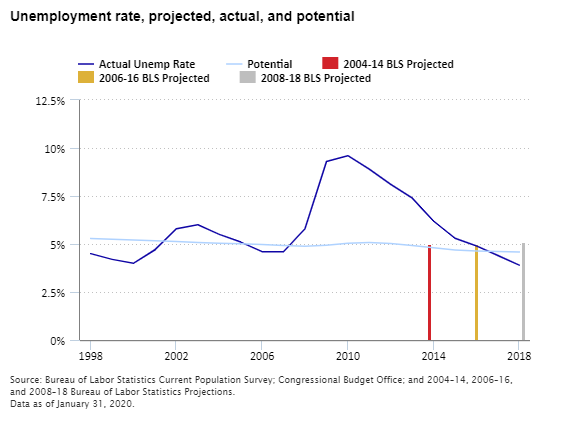
This page compares multiple BLS projection sets. The accuracy of any single projection can be largely influenced by which part of the business cycle the economy is in at target date, as well as unexpected structural changes to the economy. Looking at the accuracy of multiple projections over a longer timeframe can give a better sense of the accuracy of BLS projections than any one projection would.
BLS projects an economy at potential output (also referred to as full employment)1. Therefore, BLS recommends comparing its projections to historical estimates at potential2 to gauge accuracy. In some instances it is still useful to compare projections to actual (non–potential) data. Multiple BLS projections are compared to historical estimates of potential as well as actual data for GDP and the unemployment rate to help assess the accuracy of its projections.
The projections evaluations covers the most recent publications whose target date has elapsed. These currently include 2008–18, 2006–16, 2004–14, and 2002–12. For more information, refer to our evaluation methodology. Future evaluations will be added as they become available at which point the oldest will be dropped.
The 2007–09 recession revealed structural changes to the economy that BLS did not foresee during the 2004, 2006, and 2008 projections. The growth rate of potential output was less than expected. Cyclical effects masked this lower growth rate in the run up to the recession. This was especially pronounced for 2006–16 projections, a year before the recession, when BLS projected GDP 19.6 percent higher than potential. 2008 projections occurred during the recession, so many of the structural changes had been identified at this point. Much of the structural changes that affected potential are due to changes in the labor force participation rates (See labor force accuracy assessment).
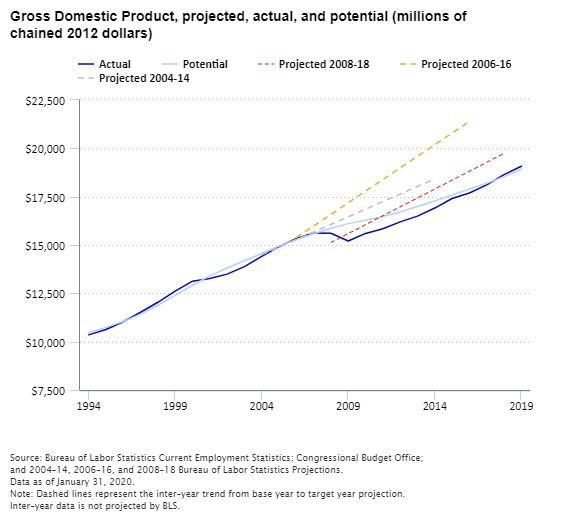
| Year | Source | Level | Difference from potential | In percent | Difference from actual | In percent |
|---|---|---|---|---|---|---|
|
2014 |
BLS Projection | 18,420.9 | 1,141.5 | 6.6 | 1,508.9 | 8.9 |
| Actual (BEA) | 16,912.0 | -367.4 | -2.1 | . | . | |
| Potential (CBO) | 17,279.4 | . | . | 367.4 | 2.2 | |
|
2016 |
BLS Projection | 21,391.6 | 3,499.2 | 19.6 | 3,702.7 | 20.9 |
| Actual (BEA) | 17,688.9 | -203.5 | -1.1 | . | . | |
| Potential (CBO) | 17,892.4 | . | . | 203.5 | 1.2 | |
|
2018 |
BLS Projection | 19,736.9 | 1,201.1 | 6.5 | 1,098.7 | 5.9 |
| Actual (BEA) | 18,638.2 | 102.4 | 0.6 | . | . | |
| Potential (CBO) | 18,535.8 | . | . | -102.4 | -0.5 | |
|
Note: Data as of January 31, 2020 |
||||||
1 For a more detailed explanation of potential output and how it relates to BLS projections see Full employment, an assumption within BLS projections
2 All historical estimates of potential output and unemployment at potential come from the Congressional Budget Office (CBO)
Return to Projections Evaluation Homepage
Last Modified Date: March 16, 2020