
An official website of the United States government
An official website of the United States government
The .gov means it's official.
Federal government websites often end in .gov or .mil. Before sharing sensitive information,
make sure you're on a federal government site.
The site is secure.
The
https:// ensures that you are connecting to the official website and that any
information you provide is encrypted and transmitted securely.
This major group comprises the following occupations: Chiropractors ; Dentists, General ; Oral and Maxillofacial Surgeons ; Orthodontists ; Prosthodontists ; Dentists, All Other Specialists ; Dietitians and Nutritionists ; Optometrists ; Pharmacists ; Anesthesiologists ; Family and General Practitioners ; Internists, General ; Obstetricians and Gynecologists ; Pediatricians, General ; Psychiatrists ; Surgeons ; Physicians and Surgeons, All Other ; Physician Assistants ; Podiatrists ; Occupational Therapists ; Physical Therapists ; Radiation Therapists ; Recreational Therapists ; Respiratory Therapists ; Speech-Language Pathologists ; Exercise Physiologists ; Therapists, All Other ; Veterinarians ; Registered Nurses ; Nurse Anesthetists ; Nurse Midwives ; Nurse Practitioners ; Audiologists ; Health Diagnosing and Treating Practitioners, All Other ; Medical and Clinical Laboratory Technologists ; Medical and Clinical Laboratory Technicians ; Dental Hygienists ; Cardiovascular Technologists and Technicians ; Diagnostic Medical Sonographers ; Nuclear Medicine Technologists ; Radiologic Technologists ; Magnetic Resonance Imaging Technologists ; Emergency Medical Technicians and Paramedics ; Dietetic Technicians ; Pharmacy Technicians ; Psychiatric Technicians ; Respiratory Therapy Technicians ; Surgical Technologists ; Veterinary Technologists and Technicians ; Ophthalmic Medical Technicians ; Licensed Practical and Licensed Vocational Nurses ; Medical Records and Health Information Technicians ; Opticians, Dispensing ; Orthotists and Prosthetists ; Hearing Aid Specialists ; Health Technologists and Technicians, All Other ; Occupational Health and Safety Specialists ; Occupational Health and Safety Technicians ; Athletic Trainers ; Genetic Counselors ; Healthcare Practitioners and Technical Workers, All Other
Employment estimate and mean wage estimates for this major group:
| Employment (1) | Employment RSE (3) |
Mean hourly wage |
Mean annual wage (2) |
Wage RSE (3) |
|---|---|---|---|---|
| 8,318,500 | 0.4 % | $38.06 | $79,160 | 0.2 % |
Percentile wage estimates for this major group:
| Percentile | 10% | 25% | 50% (Median) |
75% | 90% |
|---|---|---|---|---|---|
| Hourly Wage | $15.59 | $21.80 | $30.49 | $43.83 | $64.87 |
| Annual Wage (2) | $32,430 | $45,330 | $63,420 | $91,180 | $134,930 |
Industries with the highest published employment and wages for this occupation are provided. For a list of all industries with employment in this occupation, see the Create Customized Tables function.
Industries with the highest levels of employment in this occupation:
| Industry | Employment (1) | Percent of industry employment | Hourly mean wage | Annual mean wage (2) |
|---|---|---|---|---|
| General Medical and Surgical Hospitals | 3,031,760 | 56.04 | $36.05 | $74,980 |
| Offices of Physicians | 1,078,640 | 42.86 | $59.82 | $124,430 |
| Nursing Care Facilities (Skilled Nursing Facilities) | 443,160 | 27.00 | $26.87 | $55,890 |
| Health and Personal Care Stores | 385,830 | 36.66 | $30.93 | $64,340 |
| Outpatient Care Centers | 333,950 | 40.03 | $38.88 | $80,880 |
Industries with the highest concentration of employment in this occupation:
| Industry | Employment (1) | Percent of industry employment | Hourly mean wage | Annual mean wage (2) |
|---|---|---|---|---|
| General Medical and Surgical Hospitals | 3,031,760 | 56.04 | $36.05 | $74,980 |
| Other Ambulatory Health Care Services | 158,950 | 55.03 | $19.37 | $40,300 |
| Specialty (except Psychiatric and Substance Abuse) Hospitals | 130,910 | 51.17 | $36.97 | $76,890 |
| Offices of Physicians | 1,078,640 | 42.86 | $59.82 | $124,430 |
| Medical and Diagnostic Laboratories | 107,100 | 40.63 | $32.91 | $68,450 |
Top paying industries for this occupation:
| Industry | Employment (1) | Percent of industry employment | Hourly mean wage | Annual mean wage (2) |
|---|---|---|---|---|
| Offices of Physicians | 1,078,640 | 42.86 | $59.82 | $124,430 |
| Software Publishers | 50 | 0.02 | $53.88 | $112,060 |
| Offices of Dentists | 312,680 | 34.09 | $53.30 | $110,860 |
| Pipeline Transportation of Crude Oil | 30 | 0.28 | $47.95 | $99,750 |
| Federal Executive Branch (OES Designation) | 211,510 | 10.46 | $47.77 | $99,360 |
States and areas with the highest published employment, location quotients, and wages for this occupation are provided. For a list of all areas with employment in this occupation, see the Create Customized Tables function.
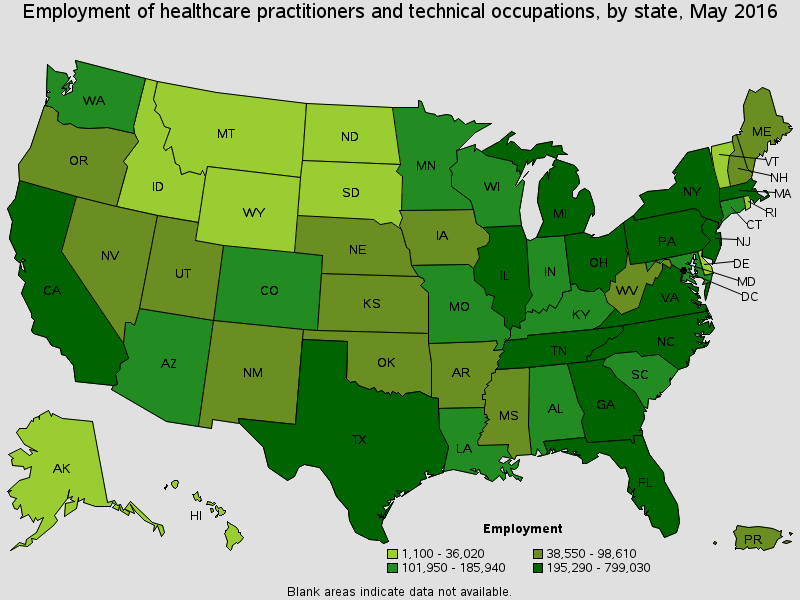
States with the highest employment level in this occupation:
| State | Employment (1) | Employment per thousand jobs | Location quotient (9) | Hourly mean wage | Annual mean wage (2) |
|---|---|---|---|---|---|
| California | 799,030 | 50.04 | 0.84 | $45.42 | $94,480 |
| Texas | 645,920 | 54.99 | 0.93 | $36.30 | $75,500 |
| New York | 528,800 | 58.12 | 0.98 | $42.50 | $88,390 |
| Florida | 512,580 | 62.34 | 1.05 | $35.97 | $74,820 |
| Pennsylvania | 386,050 | 67.17 | 1.13 | $35.86 | $74,590 |
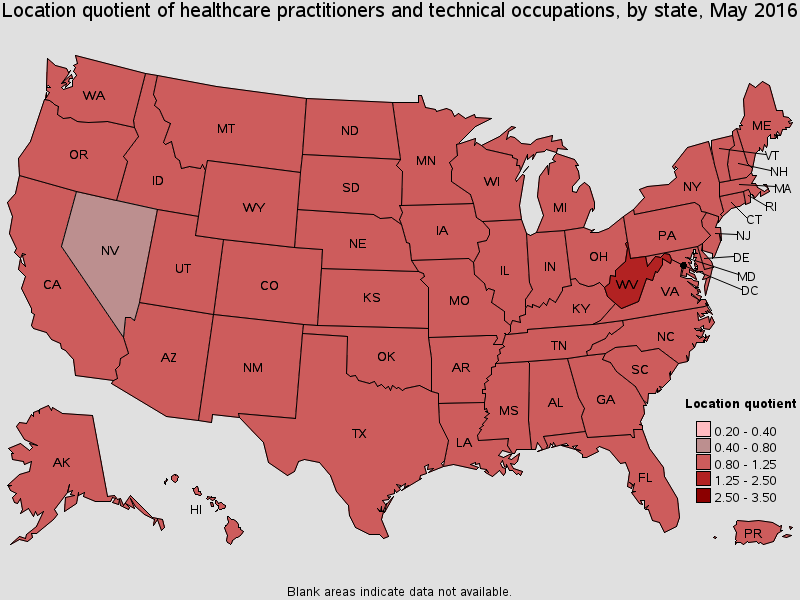
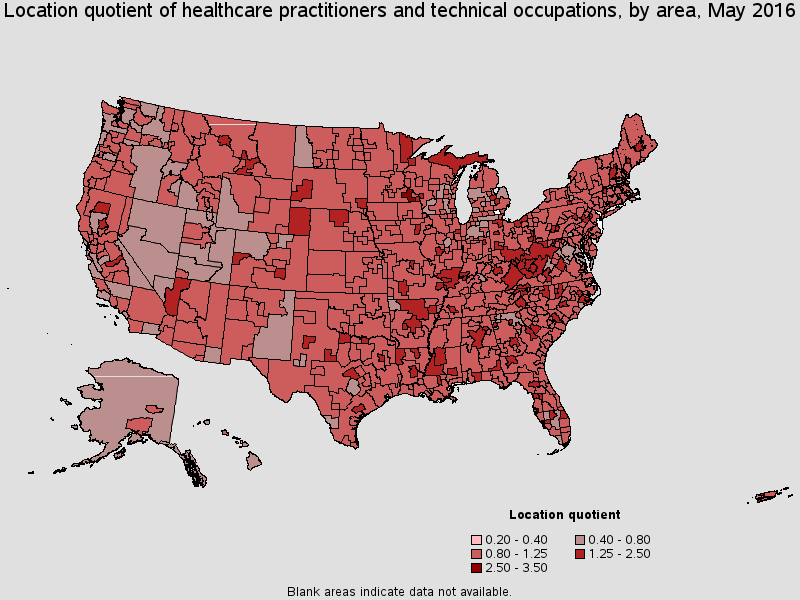
States with the highest concentration of jobs and location quotients in this occupation:
| State | Employment (1) | Employment per thousand jobs | Location quotient (9) | Hourly mean wage | Annual mean wage (2) |
|---|---|---|---|---|---|
| West Virginia | 58,860 | 84.40 | 1.42 | $32.24 | $67,070 |
| South Dakota | 29,800 | 71.37 | 1.20 | $33.29 | $69,230 |
| Mississippi | 77,970 | 69.78 | 1.18 | $30.87 | $64,210 |
| Massachusetts | 240,340 | 69.46 | 1.17 | $44.29 | $92,130 |
| Delaware | 30,160 | 68.43 | 1.15 | $40.18 | $83,570 |
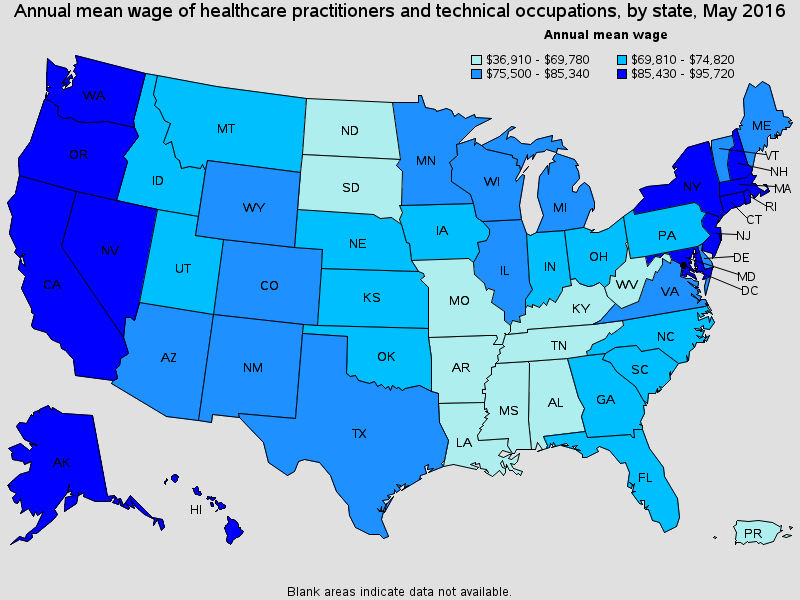
Top paying States for this occupation:
| State | Employment (1) | Employment per thousand jobs | Location quotient (9) | Hourly mean wage | Annual mean wage (2) |
|---|---|---|---|---|---|
| Alaska | 16,510 | 51.04 | 0.86 | $46.02 | $95,720 |
| California | 799,030 | 50.04 | 0.84 | $45.42 | $94,480 |
| Massachusetts | 240,340 | 69.46 | 1.17 | $44.29 | $92,130 |
| District of Columbia | 30,660 | 43.65 | 0.74 | $43.57 | $90,630 |
| Hawaii | 31,190 | 49.33 | 0.83 | $43.43 | $90,330 |
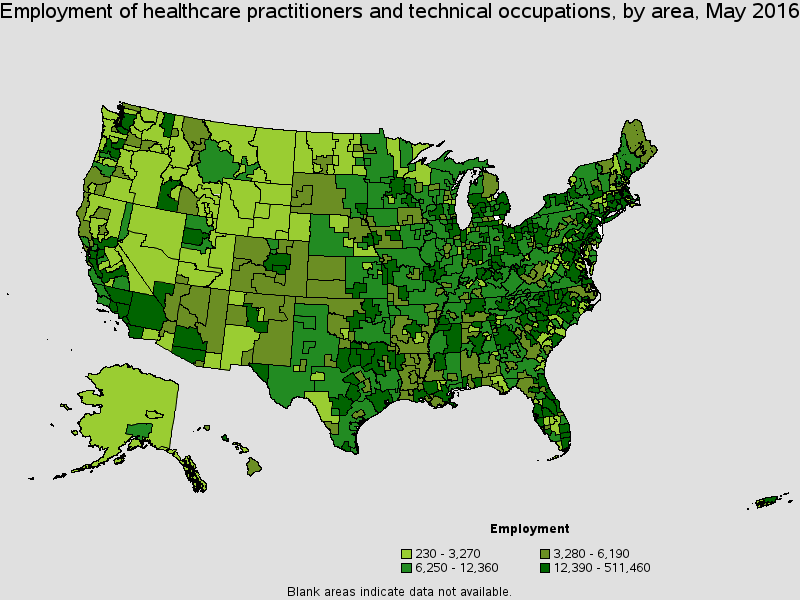
Metropolitan areas with the highest employment level in this occupation:
| Metropolitan area | Employment (1) | Employment per thousand jobs | Location quotient (9) | Hourly mean wage | Annual mean wage (2) |
|---|---|---|---|---|---|
| New York-Jersey City-White Plains, NY-NJ Metropolitan Division | 353,680 | 53.70 | 0.91 | $45.66 | $94,980 |
| Los Angeles-Long Beach-Glendale, CA Metropolitan Division | 213,860 | 50.67 | 0.86 | $43.68 | $90,860 |
| Chicago-Naperville-Arlington Heights, IL Metropolitan Division | 203,490 | 55.93 | 0.94 | $38.56 | $80,200 |
| Houston-The Woodlands-Sugar Land, TX | 153,680 | 52.36 | 0.88 | $38.32 | $79,700 |
| Atlanta-Sandy Springs-Roswell, GA | 128,200 | 50.21 | 0.85 | $38.00 | $79,040 |
| Dallas-Plano-Irving, TX Metropolitan Division | 124,310 | 51.15 | 0.86 | $37.98 | $78,990 |
| Boston-Cambridge-Newton, MA NECTA Division | 124,290 | 68.93 | 1.16 | $47.34 | $98,470 |
| Phoenix-Mesa-Scottsdale, AZ | 107,250 | 55.42 | 0.94 | $37.36 | $77,700 |
| Washington-Arlington-Alexandria, DC-VA-MD-WV Metropolitan Division | 105,760 | 42.46 | 0.72 | $43.29 | $90,040 |
| Minneapolis-St. Paul-Bloomington, MN-WI | 105,520 | 55.24 | 0.93 | $41.90 | $87,150 |
Metropolitan areas with the highest concentration of jobs and location quotients in this occupation:
| Metropolitan area | Employment (1) | Employment per thousand jobs | Location quotient (9) | Hourly mean wage | Annual mean wage (2) |
|---|---|---|---|---|---|
| Rochester, MN | 19,940 | 173.93 | 2.94 | $35.97 | $74,830 |
| Bloomsburg-Berwick, PA | 6,100 | 144.45 | 2.44 | $29.13 | $60,600 |
| Greenville, NC | 8,130 | 110.00 | 1.86 | $34.06 | $70,850 |
| Morgantown, WV | 6,970 | 108.93 | 1.84 | $31.11 | $64,710 |
| Gainesville, FL | 13,890 | 108.73 | 1.84 | $38.33 | $79,720 |
| Johnson City, TN | 8,400 | 107.50 | 1.81 | $29.88 | $62,150 |
| Rome, GA | 3,840 | 105.32 | 1.78 | $35.56 | $73,970 |
| Beckley, WV | 4,400 | 102.24 | 1.73 | $31.31 | $65,130 |
| Huntington-Ashland, WV-KY-OH | 13,350 | 101.83 | 1.72 | $33.74 | $70,180 |
| Durham-Chapel Hill, NC | 29,160 | 99.60 | 1.68 | $34.91 | $72,610 |
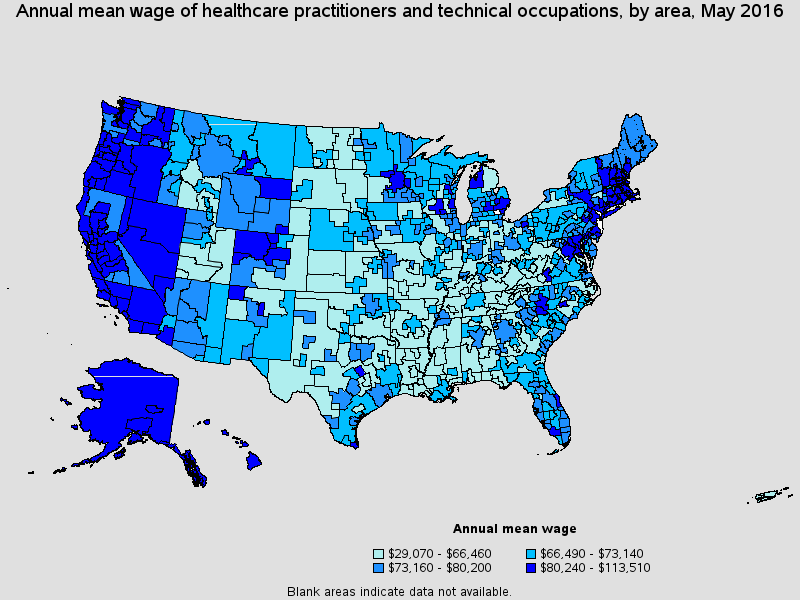
Top paying metropolitan areas for this occupation:
| Metropolitan area | Employment (1) | Employment per thousand jobs | Location quotient (9) | Hourly mean wage | Annual mean wage (2) |
|---|---|---|---|---|---|
| San Jose-Sunnyvale-Santa Clara, CA | 42,390 | 40.55 | 0.68 | $54.57 | $113,510 |
| San Francisco-Redwood City-South San Francisco, CA Metropolitan Division | 42,850 | 40.15 | 0.68 | $53.91 | $112,140 |
| Napa, CA | 4,180 | 59.07 | 1.00 | $51.76 | $107,670 |
| San Rafael, CA Metropolitan Division | 5,220 | 46.75 | 0.79 | $51.44 | $107,000 |
| Salinas, CA | 6,580 | 39.94 | 0.67 | $50.87 | $105,810 |
| Oakland-Hayward-Berkeley, CA Metropolitan Division | 56,660 | 52.25 | 0.88 | $50.15 | $104,310 |
| Vallejo-Fairfield, CA | 9,100 | 70.67 | 1.19 | $49.91 | $103,810 |
| Santa Maria-Santa Barbara, CA | 8,270 | 45.36 | 0.77 | $49.10 | $102,140 |
| Sacramento--Roseville--Arden-Arcade, CA | 49,760 | 54.50 | 0.92 | $48.87 | $101,650 |
| Silver Spring-Frederick-Rockville, MD Metropolitan Division | 40,770 | 70.12 | 1.18 | $48.51 | $100,900 |
Nonmetropolitan areas with the highest employment in this occupation:
| Nonmetropolitan area | Employment (1) | Employment per thousand jobs | Location quotient (9) | Hourly mean wage | Annual mean wage (2) |
|---|---|---|---|---|---|
| North Northeastern Ohio non-metropolitan area (non-contiguous) | 18,390 | 55.68 | 0.94 | $31.90 | $66,340 |
| Piedmont North Carolina nonmetropolitan area | 15,850 | 62.16 | 1.05 | $33.22 | $69,100 |
| Northeast Mississippi nonmetropolitan area | 14,540 | 63.40 | 1.07 | $30.37 | $63,170 |
| North Texas nonmetropolitan area | 14,350 | 53.87 | 0.91 | $30.21 | $62,840 |
| Southeast Coastal North Carolina nonmetropolitan area | 14,190 | 57.20 | 0.97 | $31.54 | $65,600 |
Nonmetropolitan areas with the highest concentration of jobs and location quotients in this occupation:
| Nonmetropolitan area | Employment (1) | Employment per thousand jobs | Location quotient (9) | Hourly mean wage | Annual mean wage (2) |
|---|---|---|---|---|---|
| East Kentucky nonmetropolitan area | 10,730 | 104.88 | 1.77 | $29.62 | $61,600 |
| West Central New Hampshire nonmetropolitan area | 6,160 | 95.86 | 1.62 | $46.30 | $96,310 |
| Southern West Virginia nonmetropolitan area | 5,910 | 78.33 | 1.32 | $27.46 | $57,120 |
| Southern Ohio non-metropolitan area | 12,090 | 77.44 | 1.31 | $27.99 | $58,220 |
| Northwest Nebraska nonmetropolitan area | 3,130 | 76.04 | 1.28 | $31.62 | $65,770 |
Top paying nonmetropolitan areas for this occupation:
| Nonmetropolitan area | Employment (1) | Employment per thousand jobs | Location quotient (9) | Hourly mean wage | Annual mean wage (2) |
|---|---|---|---|---|---|
| Balance of Alaska nonmetropolitan area | 2,930 | 39.74 | 0.67 | $51.31 | $106,720 |
| Southeast Alaska nonmetropolitan area | 1,550 | 43.97 | 0.74 | $49.03 | $101,980 |
| West Central New Hampshire nonmetropolitan area | 6,160 | 95.86 | 1.62 | $46.30 | $96,310 |
| Los Alamos County, New Mexico nonmetropolitan area | 490 | 32.16 | 0.54 | $44.56 | $92,690 |
| Northwest Washington nonmetropolitan area | 2,880 | 57.96 | 0.98 | $43.79 | $91,090 |
These estimates are calculated with data collected from employers in all industry sectors, all metropolitan and nonmetropolitan areas, and all states and the District of Columbia.
The percentile wage estimate is the value of a wage below which a certain percent of workers fall. The median wage is the 50th percentile wage estimate--50 percent of workers earn less than the median and 50 percent of workers earn more than the median. More about percentile wages.
(1) Estimates for detailed occupations do not sum to the totals because the totals include occupations not shown separately. Estimates do not include self-employed workers.
(2) Annual wages have been calculated by multiplying the hourly mean wage by a "year-round, full-time" hours figure of 2,080 hours; for those occupations where there is not an hourly wage published, the annual wage has been directly calculated from the reported survey data.
(3) The relative standard error (RSE) is a measure of the reliability of a survey statistic. The smaller the relative standard error, the more precise the estimate.
(9) The location quotient is the ratio of the area concentration of occupational employment to the national average concentration. A location quotient greater than one indicates the occupation has a higher share of employment than average, and a location quotient less than one indicates the occupation is less prevalent in the area than average.
Other OES estimates and related information:
May 2016 National Occupational Employment and Wage Estimates
May 2016 State Occupational Employment and Wage Estimates
May 2016 Metropolitan and Nonmetropolitan Area Occupational Employment and Wage Estimates
May 2016 National Industry-Specific Occupational Employment and Wage Estimates
Last Modified Date: March 31, 2017