
An official website of the United States government
An official website of the United States government
The .gov means it's official.
Federal government websites often end in .gov or .mil. Before sharing sensitive information,
make sure you're on a federal government site.
The site is secure.
The
https:// ensures that you are connecting to the official website and that any
information you provide is encrypted and transmitted securely.
This major group comprises the following occupations: First-Line Supervisors of Production and Operating Workers ; Aircraft Structure, Surfaces, Rigging, and Systems Assemblers ; Coil Winders, Tapers, and Finishers ; Electrical and Electronic Equipment Assemblers ; Electromechanical Equipment Assemblers ; Engine and Other Machine Assemblers ; Structural Metal Fabricators and Fitters ; Fiberglass Laminators and Fabricators ; Team Assemblers ; Timing Device Assemblers and Adjusters ; Assemblers and Fabricators, All Other ; Bakers ; Butchers and Meat Cutters ; Meat, Poultry, and Fish Cutters and Trimmers ; Slaughterers and Meat Packers ; Food and Tobacco Roasting, Baking, and Drying Machine Operators and Tenders ; Food Batchmakers ; Food Cooking Machine Operators and Tenders ; Food Processing Workers, All Other ; Computer-Controlled Machine Tool Operators, Metal and Plastic ; Computer Numerically Controlled Machine Tool Programmers, Metal and Plastic ; Extruding and Drawing Machine Setters, Operators, and Tenders, Metal and Plastic ; Forging Machine Setters, Operators, and Tenders, Metal and Plastic ; Rolling Machine Setters, Operators, and Tenders, Metal and Plastic ; Cutting, Punching, and Press Machine Setters, Operators, and Tenders, Metal and Plastic ; Drilling and Boring Machine Tool Setters, Operators, and Tenders, Metal and Plastic ; Grinding, Lapping, Polishing, and Buffing Machine Tool Setters, Operators, and Tenders, Metal and Plastic ; Lathe and Turning Machine Tool Setters, Operators, and Tenders, Metal and Plastic ; Milling and Planing Machine Setters, Operators, and Tenders, Metal and Plastic ; Machinists ; Metal-Refining Furnace Operators and Tenders ; Pourers and Casters, Metal ; Model Makers, Metal and Plastic ; Patternmakers, Metal and Plastic ; Foundry Mold and Coremakers ; Molding, Coremaking, and Casting Machine Setters, Operators, and Tenders, Metal and Plastic ; Multiple Machine Tool Setters, Operators, and Tenders, Metal and Plastic ; Tool and Die Makers ; Welders, Cutters, Solderers, and Brazers ; Welding, Soldering, and Brazing Machine Setters, Operators, and Tenders ; Heat Treating Equipment Setters, Operators, and Tenders, Metal and Plastic ; Layout Workers, Metal and Plastic ; Plating and Coating Machine Setters, Operators, and Tenders, Metal and Plastic ; Tool Grinders, Filers, and Sharpeners ; Metal Workers and Plastic Workers, All Other ; Prepress Technicians and Workers ; Printing Press Operators ; Print Binding and Finishing Workers ; Laundry and Dry-Cleaning Workers ; Pressers, Textile, Garment, and Related Materials ; Sewing Machine Operators ; Shoe and Leather Workers and Repairers ; Shoe Machine Operators and Tenders ; Sewers, Hand ; Tailors, Dressmakers, and Custom Sewers ; Textile Bleaching and Dyeing Machine Operators and Tenders ; Textile Cutting Machine Setters, Operators, and Tenders ; Textile Knitting and Weaving Machine Setters, Operators, and Tenders ; Textile Winding, Twisting, and Drawing Out Machine Setters, Operators, and Tenders ; Extruding and Forming Machine Setters, Operators, and Tenders, Synthetic and Glass Fibers ; Fabric and Apparel Patternmakers ; Upholsterers ; Textile, Apparel, and Furnishings Workers, All Other ; Cabinetmakers and Bench Carpenters ; Furniture Finishers ; Model Makers, Wood ; Patternmakers, Wood ; Sawing Machine Setters, Operators, and Tenders, Wood ; Woodworking Machine Setters, Operators, and Tenders, Except Sawing ; Woodworkers, All Other ; Nuclear Power Reactor Operators ; Power Distributors and Dispatchers ; Power Plant Operators ; Stationary Engineers and Boiler Operators ; Water and Wastewater Treatment Plant and System Operators ; Chemical Plant and System Operators ; Gas Plant Operators ; Petroleum Pump System Operators, Refinery Operators, and Gaugers ; Plant and System Operators, All Other ; Chemical Equipment Operators and Tenders ; Separating, Filtering, Clarifying, Precipitating, and Still Machine Setters, Operators, and Tenders ; Crushing, Grinding, and Polishing Machine Setters, Operators, and Tenders ; Grinding and Polishing Workers, Hand ; Mixing and Blending Machine Setters, Operators, and Tenders ; Cutters and Trimmers, Hand ; Cutting and Slicing Machine Setters, Operators, and Tenders ; Extruding, Forming, Pressing, and Compacting Machine Setters, Operators, and Tenders ; Furnace, Kiln, Oven, Drier, and Kettle Operators and Tenders ; Inspectors, Testers, Sorters, Samplers, and Weighers ; Jewelers and Precious Stone and Metal Workers ; Dental Laboratory Technicians ; Medical Appliance Technicians ; Ophthalmic Laboratory Technicians ; Packaging and Filling Machine Operators and Tenders ; Coating, Painting, and Spraying Machine Setters, Operators, and Tenders ; Painters, Transportation Equipment ; Painting, Coating, and Decorating Workers ; Semiconductor Processors ; Photographic Process Workers and Processing Machine Operators ; Adhesive Bonding Machine Operators and Tenders ; Cleaning, Washing, and Metal Pickling Equipment Operators and Tenders ; Cooling and Freezing Equipment Operators and Tenders ; Etchers and Engravers ; Molders, Shapers, and Casters, Except Metal and Plastic ; Paper Goods Machine Setters, Operators, and Tenders ; Tire Builders ; Helpers--Production Workers ; Production Workers, All Other
Employment estimate and mean wage estimates for this major group:
| Employment (1) | Employment RSE (3) |
Mean hourly wage |
Mean annual wage (2) |
Wage RSE (3) |
|---|---|---|---|---|
| 9,105,650 | 0.3 % | $17.88 | $37,190 | 0.2 % |
Percentile wage estimates for this major group:
| Percentile | 10% | 25% | 50% (Median) |
75% | 90% |
|---|---|---|---|---|---|
| Hourly Wage | $9.96 | $11.98 | $15.93 | $21.81 | $28.99 |
| Annual Wage (2) | $20,720 | $24,920 | $33,130 | $45,360 | $60,300 |
Industries with the highest published employment and wages for this occupation are provided. For a list of all industries with employment in this occupation, see the Create Customized Tables function.
Industries with the highest levels of employment in this occupation:
| Industry | Employment (1) | Percent of industry employment | Hourly mean wage | Annual mean wage (2) |
|---|---|---|---|---|
| Employment Services | 762,500 | 21.07 | $13.34 | $27,750 |
| Motor Vehicle Parts Manufacturing | 372,030 | 64.16 | $17.99 | $37,410 |
| Plastics Product Manufacturing | 335,510 | 59.48 | $16.25 | $33,790 |
| Animal Slaughtering and Processing | 322,570 | 65.66 | $13.66 | $28,420 |
| Machine Shops; Turned Product; and Screw, Nut, and Bolt Manufacturing | 248,810 | 69.82 | $19.94 | $41,470 |
Industries with the highest concentration of employment in this occupation:
| Industry | Employment (1) | Percent of industry employment | Hourly mean wage | Annual mean wage (2) |
|---|---|---|---|---|
| Motor Vehicle Manufacturing | 158,830 | 76.72 | $23.64 | $49,160 |
| Fiber, Yarn, and Thread Mills | 20,850 | 70.50 | $13.99 | $29,100 |
| Machine Shops; Turned Product; and Screw, Nut, and Bolt Manufacturing | 248,810 | 69.82 | $19.94 | $41,470 |
| Foundries | 82,980 | 68.59 | $18.08 | $37,610 |
| Motor Vehicle Body and Trailer Manufacturing | 101,990 | 67.64 | $18.08 | $37,610 |
Top paying industries for this occupation:
| Industry | Employment (1) | Percent of industry employment | Hourly mean wage | Annual mean wage (2) |
|---|---|---|---|---|
| Electric Power Generation, Transmission and Distribution | 52,380 | 13.52 | $38.10 | $79,240 |
| Natural Gas Distribution | 12,550 | 11.09 | $36.98 | $76,910 |
| Pipeline Transportation of Crude Oil | 3,070 | 28.63 | $34.26 | $71,250 |
| Other Pipeline Transportation | 3,120 | 38.17 | $33.38 | $69,440 |
| Oil and Gas Extraction | 11,840 | 6.52 | $32.80 | $68,220 |
States and areas with the highest published employment, location quotients, and wages for this occupation are provided. For a list of all areas with employment in this occupation, see the Create Customized Tables function.
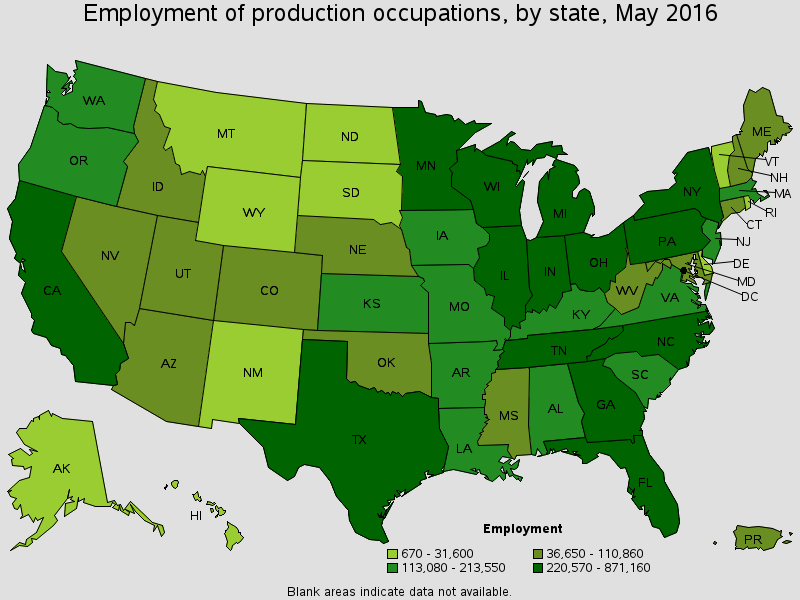
States with the highest employment level in this occupation:
| State | Employment (1) | Employment per thousand jobs | Location quotient (9) | Hourly mean wage | Annual mean wage (2) |
|---|---|---|---|---|---|
| California | 871,160 | 54.56 | 0.84 | $17.84 | $37,110 |
| Texas | 673,270 | 57.32 | 0.88 | $18.38 | $38,230 |
| Ohio | 494,570 | 92.65 | 1.43 | $18.12 | $37,700 |
| Michigan | 445,320 | 105.73 | 1.63 | $18.04 | $37,520 |
| Illinois | 434,220 | 73.55 | 1.13 | $17.86 | $37,150 |
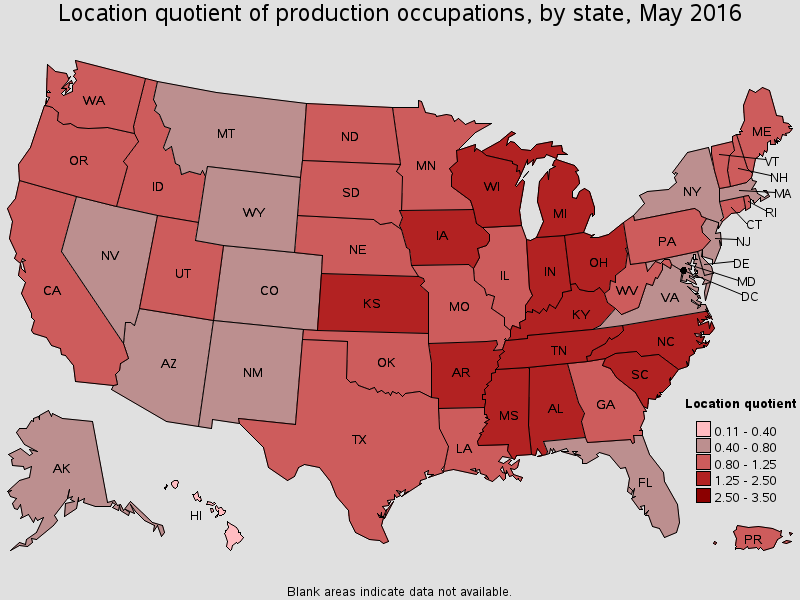
States with the highest concentration of jobs and location quotients in this occupation:
| State | Employment (1) | Employment per thousand jobs | Location quotient (9) | Hourly mean wage | Annual mean wage (2) |
|---|---|---|---|---|---|
| Indiana | 379,380 | 126.83 | 1.96 | $17.53 | $36,460 |
| Wisconsin | 322,120 | 114.84 | 1.77 | $18.05 | $37,540 |
| Alabama | 213,550 | 111.63 | 1.72 | $16.78 | $34,890 |
| Kentucky | 204,270 | 109.26 | 1.68 | $17.63 | $36,670 |
| Michigan | 445,320 | 105.73 | 1.63 | $18.04 | $37,520 |
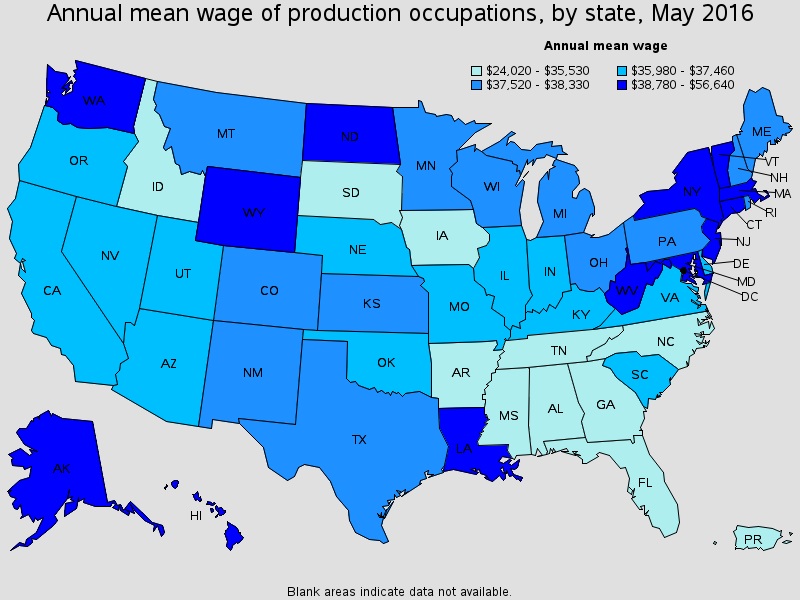
Top paying States for this occupation:
| State | Employment (1) | Employment per thousand jobs | Location quotient (9) | Hourly mean wage | Annual mean wage (2) |
|---|---|---|---|---|---|
| District of Columbia | 4,870 | 6.94 | 0.11 | $27.23 | $56,640 |
| Wyoming | 12,770 | 46.24 | 0.71 | $25.21 | $52,430 |
| Alaska | 12,430 | 38.41 | 0.59 | $22.20 | $46,170 |
| Washington | 182,540 | 59.52 | 0.92 | $21.43 | $44,580 |
| Louisiana | 118,200 | 61.50 | 0.95 | $21.33 | $44,360 |
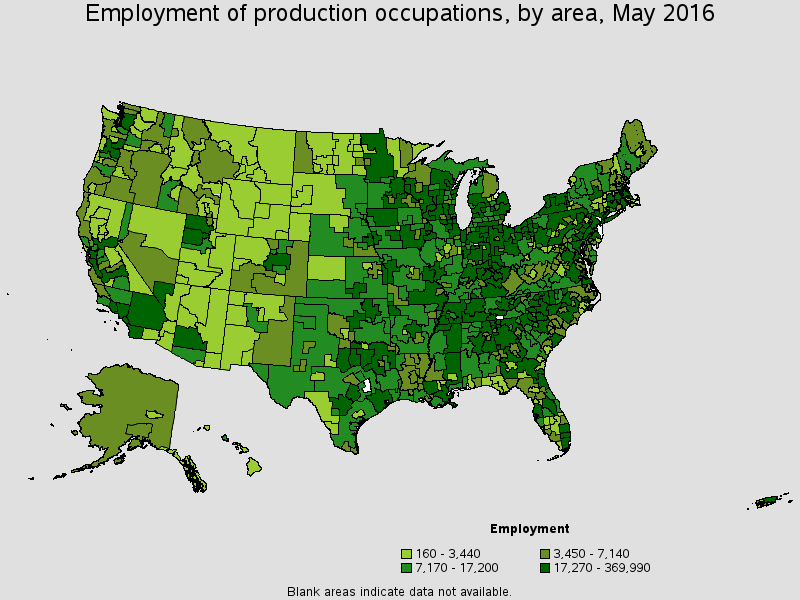
Metropolitan areas with the highest employment level in this occupation:
| Metropolitan area | Employment (1) | Employment per thousand jobs | Location quotient (9) | Hourly mean wage | Annual mean wage (2) |
|---|---|---|---|---|---|
| Los Angeles-Long Beach-Glendale, CA Metropolitan Division | 265,070 | 62.80 | 0.97 | $16.80 | $34,950 |
| Chicago-Naperville-Arlington Heights, IL Metropolitan Division | 239,730 | 65.89 | 1.02 | $17.70 | $36,810 |
| New York-Jersey City-White Plains, NY-NJ Metropolitan Division | 188,060 | 28.55 | 0.44 | $18.41 | $38,300 |
| Houston-The Woodlands-Sugar Land, TX | 185,140 | 63.08 | 0.97 | $20.50 | $42,630 |
| Atlanta-Sandy Springs-Roswell, GA | 140,310 | 54.95 | 0.85 | $16.23 | $33,750 |
| Minneapolis-St. Paul-Bloomington, MN-WI | 135,150 | 70.75 | 1.09 | $18.72 | $38,950 |
| Dallas-Plano-Irving, TX Metropolitan Division | 125,610 | 51.69 | 0.80 | $16.59 | $34,510 |
| Warren-Troy-Farmington Hills, MI Metropolitan Division | 120,960 | 100.26 | 1.55 | $18.78 | $39,070 |
| Anaheim-Santa Ana-Irvine, CA Metropolitan Division | 104,910 | 67.12 | 1.03 | $16.87 | $35,080 |
| Seattle-Bellevue-Everett, WA Metropolitan Division | 95,860 | 60.34 | 0.93 | $22.63 | $47,070 |
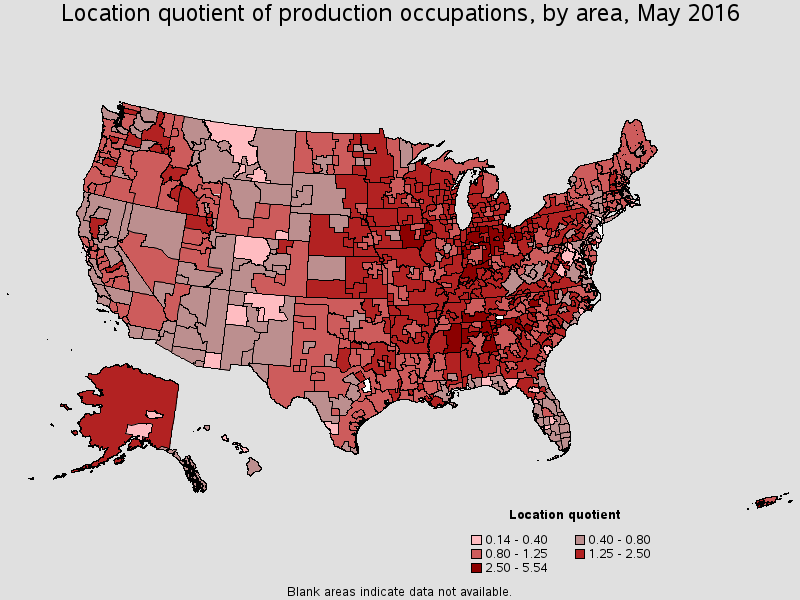
Metropolitan areas with the highest concentration of jobs and location quotients in this occupation:
| Metropolitan area | Employment (1) | Employment per thousand jobs | Location quotient (9) | Hourly mean wage | Annual mean wage (2) |
|---|---|---|---|---|---|
| Elkhart-Goshen, IN | 45,530 | 359.28 | 5.54 | $17.76 | $36,940 |
| Columbus, IN | 12,690 | 258.27 | 3.98 | $16.32 | $33,940 |
| Dalton, GA | 17,270 | 252.83 | 3.90 | $15.11 | $31,440 |
| Hickory-Lenoir-Morganton, NC | 30,480 | 205.11 | 3.16 | $16.17 | $33,620 |
| Sheboygan, WI | 11,580 | 196.63 | 3.03 | $18.92 | $39,360 |
| Gadsden, AL | 6,460 | 179.47 | 2.77 | $14.89 | $30,980 |
| Morristown, TN | 7,320 | 172.89 | 2.67 | $14.80 | $30,780 |
| Jackson, MI | 9,800 | 165.87 | 2.56 | $16.66 | $34,650 |
| Oshkosh-Neenah, WI | 14,870 | 161.80 | 2.49 | $19.50 | $40,570 |
| Wausau, WI | 11,220 | 161.33 | 2.49 | $17.84 | $37,100 |
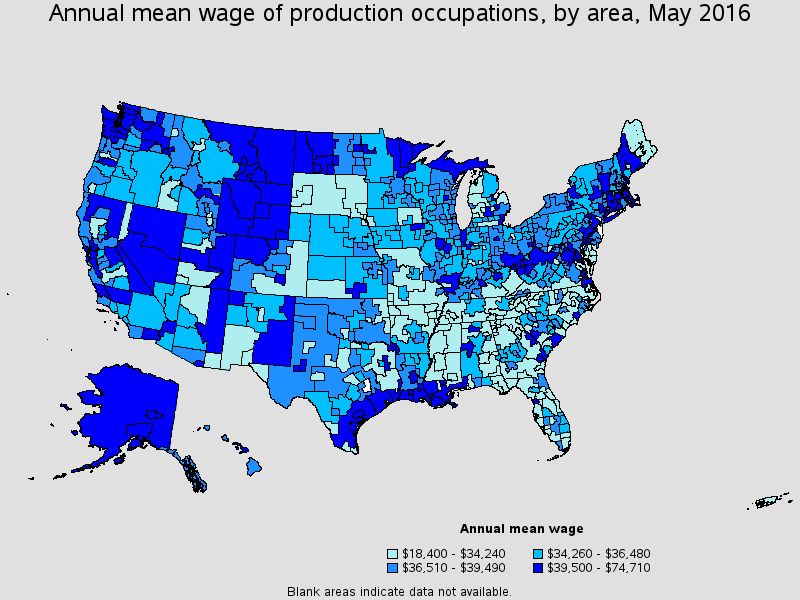
Top paying metropolitan areas for this occupation:
| Metropolitan area | Employment (1) | Employment per thousand jobs | Location quotient (9) | Hourly mean wage | Annual mean wage (2) |
|---|---|---|---|---|---|
| Beaumont-Port Arthur, TX | 15,750 | 97.01 | 1.50 | $27.89 | $58,000 |
| Fairbanks, AK | 830 | 22.27 | 0.34 | $26.23 | $54,560 |
| Lynn-Saugus-Marblehead, MA NECTA Division | 1,860 | 43.39 | 0.67 | $25.61 | $53,270 |
| Baton Rouge, LA | 25,090 | 63.36 | 0.98 | $25.22 | $52,450 |
| Farmington, NM | 2,330 | 47.04 | 0.73 | $24.96 | $51,910 |
| Bremerton-Silverdale, WA | 4,050 | 48.32 | 0.75 | $24.68 | $51,340 |
| San Rafael, CA Metropolitan Division | 2,670 | 23.92 | 0.37 | $24.64 | $51,250 |
| Lake Charles, LA | 8,260 | 80.59 | 1.24 | $24.61 | $51,200 |
| Norwich-New London-Westerly, CT-RI | 6,110 | 48.06 | 0.74 | $24.38 | $50,710 |
| Longview, WA | 3,070 | 85.93 | 1.32 | $23.53 | $48,930 |
Nonmetropolitan areas with the highest employment in this occupation:
| Nonmetropolitan area | Employment (1) | Employment per thousand jobs | Location quotient (9) | Hourly mean wage | Annual mean wage (2) |
|---|---|---|---|---|---|
| North Northeastern Ohio non-metropolitan area (non-contiguous) | 57,170 | 173.08 | 2.67 | $16.78 | $34,910 |
| West Northwestern Ohio nonmetropolitan area | 56,000 | 221.41 | 3.41 | $18.45 | $38,380 |
| Northern Indiana nonmetropolitan area | 54,970 | 255.19 | 3.93 | $16.50 | $34,310 |
| Balance of Lower Peninsula of Michigan nonmetropolitan area | 40,950 | 147.02 | 2.27 | $16.06 | $33,400 |
| Southeast Iowa nonmetropolitan area | 39,320 | 171.70 | 2.65 | $16.51 | $34,340 |
Nonmetropolitan areas with the highest concentration of jobs and location quotients in this occupation:
| Nonmetropolitan area | Employment (1) | Employment per thousand jobs | Location quotient (9) | Hourly mean wage | Annual mean wage (2) |
|---|---|---|---|---|---|
| Northern Indiana nonmetropolitan area | 54,970 | 255.19 | 3.93 | $16.50 | $34,310 |
| Northeast Alabama nonmetropolitan area | 36,340 | 249.82 | 3.85 | $15.74 | $32,740 |
| West Northwestern Ohio nonmetropolitan area | 56,000 | 221.41 | 3.41 | $18.45 | $38,380 |
| Northwest Alabama nonmetropolitan area | 13,370 | 208.07 | 3.21 | $14.51 | $30,170 |
| South Central Tennessee nonmetropolitan area | 21,160 | 197.04 | 3.04 | $15.71 | $32,680 |
Top paying nonmetropolitan areas for this occupation:
| Nonmetropolitan area | Employment (1) | Employment per thousand jobs | Location quotient (9) | Hourly mean wage | Annual mean wage (2) |
|---|---|---|---|---|---|
| Los Alamos County, New Mexico nonmetropolitan area | 450 | 29.78 | 0.46 | $35.92 | $74,710 |
| Southwest Wyoming nonmetropolitan area | 3,240 | 53.47 | 0.82 | $29.37 | $61,080 |
| West Central North Dakota nonmetropolitan area | 3,280 | 55.07 | 0.85 | $27.84 | $57,910 |
| Northeast Wyoming nonmetropolitan area | 2,300 | 47.87 | 0.74 | $27.05 | $56,270 |
| East Montana nonmetropolitan area | 1,010 | 30.31 | 0.47 | $26.05 | $54,190 |
These estimates are calculated with data collected from employers in all industry sectors, all metropolitan and nonmetropolitan areas, and all states and the District of Columbia.
The percentile wage estimate is the value of a wage below which a certain percent of workers fall. The median wage is the 50th percentile wage estimate--50 percent of workers earn less than the median and 50 percent of workers earn more than the median. More about percentile wages.
(1) Estimates for detailed occupations do not sum to the totals because the totals include occupations not shown separately. Estimates do not include self-employed workers.
(2) Annual wages have been calculated by multiplying the hourly mean wage by a "year-round, full-time" hours figure of 2,080 hours; for those occupations where there is not an hourly wage published, the annual wage has been directly calculated from the reported survey data.
(3) The relative standard error (RSE) is a measure of the reliability of a survey statistic. The smaller the relative standard error, the more precise the estimate.
(9) The location quotient is the ratio of the area concentration of occupational employment to the national average concentration. A location quotient greater than one indicates the occupation has a higher share of employment than average, and a location quotient less than one indicates the occupation is less prevalent in the area than average.
Other OES estimates and related information:
May 2016 National Occupational Employment and Wage Estimates
May 2016 State Occupational Employment and Wage Estimates
May 2016 Metropolitan and Nonmetropolitan Area Occupational Employment and Wage Estimates
May 2016 National Industry-Specific Occupational Employment and Wage Estimates
Last Modified Date: March 31, 2017