
An official website of the United States government
An official website of the United States government
The .gov means it's official.
Federal government websites often end in .gov or .mil. Before sharing sensitive information,
make sure you're on a federal government site.
The site is secure.
The
https:// ensures that you are connecting to the official website and that any
information you provide is encrypted and transmitted securely.
This major group comprises the following occupations: First-Line Supervisors of Office and Administrative Support Workers ; Switchboard Operators, Including Answering Service ; Telephone Operators ; Communications Equipment Operators, All Other ; Bill and Account Collectors ; Billing and Posting Clerks ; Bookkeeping, Accounting, and Auditing Clerks ; Gambling Cage Workers ; Payroll and Timekeeping Clerks ; Procurement Clerks ; Tellers ; Financial Clerks, All Other ; Brokerage Clerks ; Correspondence Clerks ; Court, Municipal, and License Clerks ; Credit Authorizers, Checkers, and Clerks ; Customer Service Representatives ; Eligibility Interviewers, Government Programs ; File Clerks ; Hotel, Motel, and Resort Desk Clerks ; Interviewers, Except Eligibility and Loan ; Library Assistants, Clerical ; Loan Interviewers and Clerks ; New Accounts Clerks ; Order Clerks ; Human Resources Assistants, Except Payroll and Timekeeping ; Receptionists and Information Clerks ; Reservation and Transportation Ticket Agents and Travel Clerks ; Information and Record Clerks, All Other ; Cargo and Freight Agents ; Couriers and Messengers ; Public Safety Telecommunicators ; Dispatchers, Except Police, Fire, and Ambulance ; Meter Readers, Utilities ; Postal Service Clerks ; Postal Service Mail Carriers ; Postal Service Mail Sorters, Processors, and Processing Machine Operators ; Production, Planning, and Expediting Clerks ; Shipping, Receiving, and Inventory Clerks ; Weighers, Measurers, Checkers, and Samplers, Recordkeeping ; Executive Secretaries and Executive Administrative Assistants ; Legal Secretaries and Administrative Assistants ; Medical Secretaries and Administrative Assistants ; Secretaries and Administrative Assistants, Except Legal, Medical, and Executive ; Data Entry Keyers ; Word Processors and Typists ; Desktop Publishers ; Insurance Claims and Policy Processing Clerks ; Mail Clerks and Mail Machine Operators, Except Postal Service ; Office Clerks, General ; Office Machine Operators, Except Computer ; Proofreaders and Copy Markers ; Statistical Assistants ; Office and Administrative Support Workers, All Other
Employment estimate and mean wage estimates for this major group:
| Employment (1) | Employment RSE (3) |
Mean hourly wage |
Mean annual wage (2) |
Wage RSE (3) |
|---|---|---|---|---|
| 19,528,250 | 0.2 % | $19.73 | $41,040 | 0.1 % |
Percentile wage estimates for this major group:
| Percentile | 10% | 25% | 50% (Median) |
75% | 90% |
|---|---|---|---|---|---|
| Hourly Wage | $11.44 | $14.14 | $18.07 | $23.75 | $30.41 |
| Annual Wage (2) | $23,790 | $29,400 | $37,580 | $49,390 | $63,260 |
Industries with the highest published employment and wages for this occupation are provided. For a list of all industries with employment in this occupation, see the Create Customized Tables function.
Industries with the highest levels of employment in this occupation:
| Industry | Employment (1) | Percent of industry employment | Hourly mean wage | Annual mean wage (2) |
|---|---|---|---|---|
| Credit Intermediation and Related Activities (5221 And 5223 only) | 993,480 | 48.57 | $18.79 | $39,090 |
| Local Government, excluding schools and hospitals (OES Designation) | 986,750 | 17.81 | $20.78 | $43,230 |
| Offices of Physicians | 795,690 | 30.05 | $18.22 | $37,890 |
| General Medical and Surgical Hospitals | 656,590 | 11.76 | $19.59 | $40,750 |
| Employment Services | 570,790 | 15.51 | $17.98 | $37,390 |
Industries with the highest concentration of employment in this occupation:
| Industry | Employment (1) | Percent of industry employment | Hourly mean wage | Annual mean wage (2) |
|---|---|---|---|---|
| Postal Service (federal government) | 549,210 | 86.96 | $25.18 | $52,370 |
| Business Support Services | 569,930 | 63.90 | $16.51 | $34,340 |
| Freight Transportation Arrangement | 117,820 | 50.09 | $22.22 | $46,220 |
| Credit Intermediation and Related Activities (5221 And 5223 only) | 993,480 | 48.57 | $18.79 | $39,090 |
| Office Administrative Services | 207,550 | 41.65 | $20.18 | $41,970 |
Top paying industries for this occupation:
| Industry | Employment (1) | Percent of industry employment | Hourly mean wage | Annual mean wage (2) |
|---|---|---|---|---|
| Monetary Authorities-Central Bank | 2,480 | 12.99 | $29.85 | $62,090 |
| Natural Gas Distribution | 19,500 | 17.82 | $29.32 | $60,980 |
| Pipeline Transportation of Crude Oil | 960 | 8.10 | $28.53 | $59,350 |
| Electric Power Generation, Transmission and Distribution | 56,110 | 14.59 | $27.08 | $56,330 |
| Motor Vehicle Manufacturing | 3,400 | 1.45 | $26.77 | $55,690 |
States and areas with the highest published employment, location quotients, and wages for this occupation are provided. For a list of all areas with employment in this occupation, see the Create Customized Tables function.
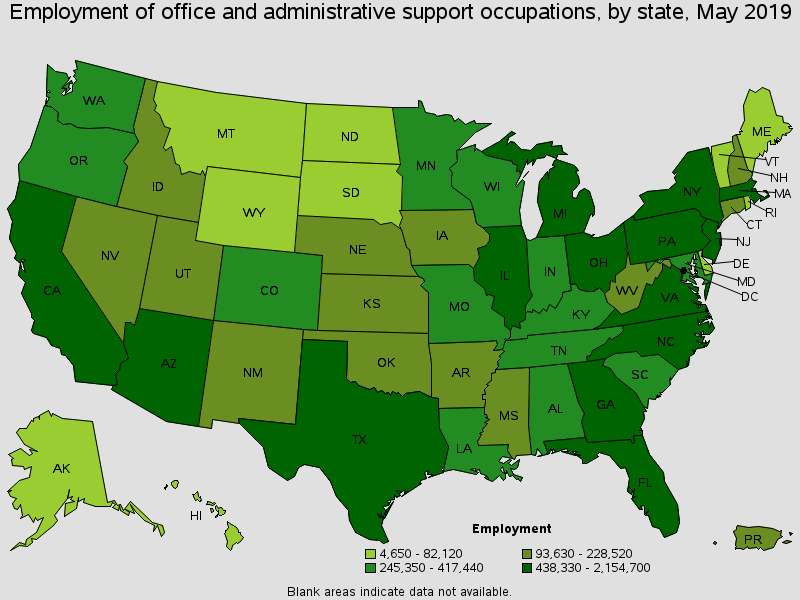
States with the highest employment level in this occupation:
| State | Employment (1) | Employment per thousand jobs | Location quotient (9) | Hourly mean wage | Annual mean wage (2) |
|---|---|---|---|---|---|
| California | 2,154,700 | 123.96 | 0.93 | $22.08 | $45,930 |
| Texas | 1,820,280 | 146.43 | 1.10 | $18.66 | $38,810 |
| New York | 1,334,940 | 140.18 | 1.05 | $22.57 | $46,940 |
| Florida | 1,294,440 | 147.20 | 1.11 | $18.33 | $38,130 |
| Pennsylvania | 825,920 | 139.95 | 1.05 | $19.45 | $40,460 |
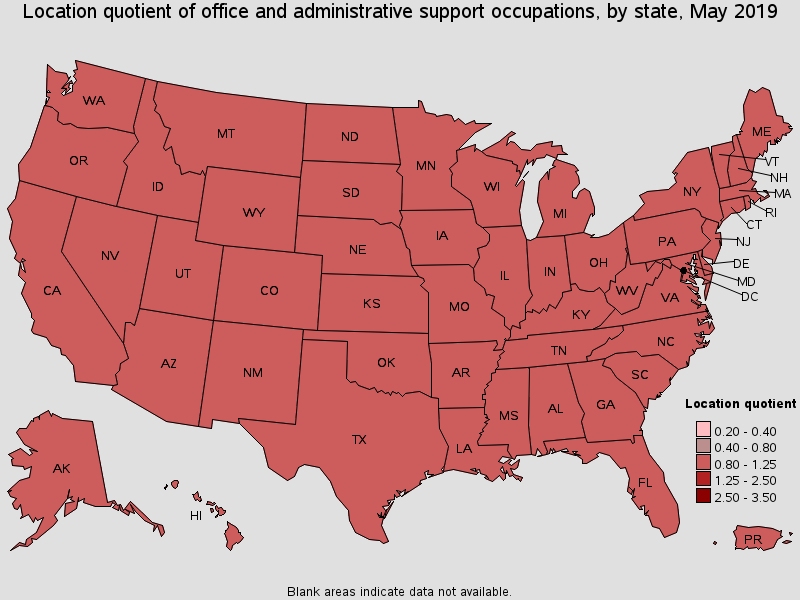
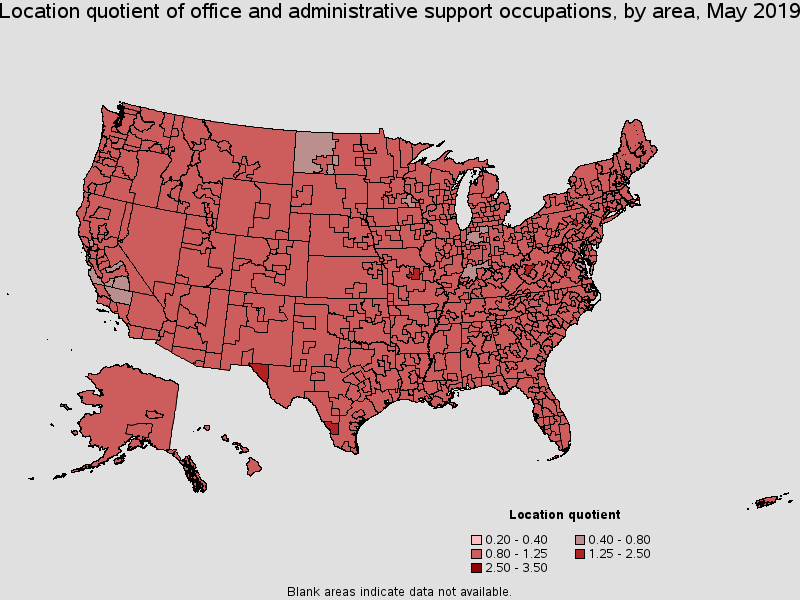
States with the highest concentration of jobs and location quotients in this occupation:
| State | Employment (1) | Employment per thousand jobs | Location quotient (9) | Hourly mean wage | Annual mean wage (2) |
|---|---|---|---|---|---|
| Arizona | 438,330 | 152.90 | 1.15 | $19.15 | $39,820 |
| Florida | 1,294,440 | 147.20 | 1.11 | $18.33 | $38,130 |
| Texas | 1,820,280 | 146.43 | 1.10 | $18.66 | $38,810 |
| Delaware | 65,890 | 145.80 | 1.10 | $19.78 | $41,150 |
| Alaska | 46,230 | 145.80 | 1.10 | $22.22 | $46,210 |
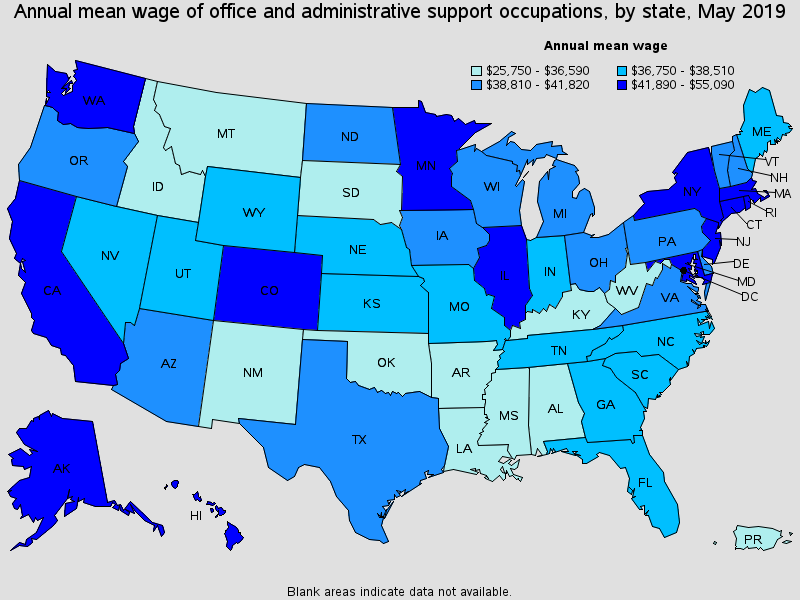
Top paying States for this occupation:
| State | Employment (1) | Employment per thousand jobs | Location quotient (9) | Hourly mean wage | Annual mean wage (2) |
|---|---|---|---|---|---|
| District of Columbia | 72,670 | 100.44 | 0.76 | $26.48 | $55,090 |
| Massachusetts | 445,160 | 122.98 | 0.92 | $23.08 | $48,000 |
| Connecticut | 224,470 | 134.81 | 1.01 | $22.78 | $47,390 |
| New York | 1,334,940 | 140.18 | 1.05 | $22.57 | $46,940 |
| Alaska | 46,230 | 145.80 | 1.10 | $22.22 | $46,210 |
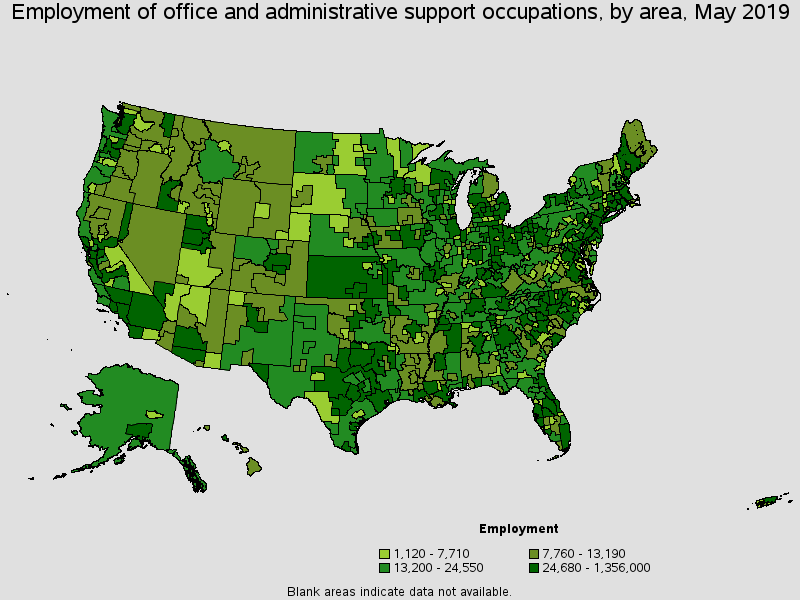
Metropolitan areas with the highest employment level in this occupation:
| Metropolitan area | Employment (1) | Employment per thousand jobs | Location quotient (9) | Hourly mean wage | Annual mean wage (2) |
|---|---|---|---|---|---|
| New York-Newark-Jersey City, NY-NJ-PA | 1,356,000 | 140.44 | 1.06 | $22.98 | $47,790 |
| Los Angeles-Long Beach-Anaheim, CA | 834,580 | 133.75 | 1.01 | $21.81 | $45,370 |
| Chicago-Naperville-Elgin, IL-IN-WI | 611,120 | 130.68 | 0.98 | $20.73 | $43,110 |
| Dallas-Fort Worth-Arlington, TX | 571,530 | 156.29 | 1.18 | $19.62 | $40,800 |
| Houston-The Woodlands-Sugar Land, TX | 419,280 | 137.37 | 1.03 | $19.79 | $41,150 |
| Philadelphia-Camden-Wilmington, PA-NJ-DE-MD | 416,410 | 144.77 | 1.09 | $20.97 | $43,620 |
| Miami-Fort Lauderdale-West Palm Beach, FL | 405,380 | 153.42 | 1.15 | $18.92 | $39,350 |
| Atlanta-Sandy Springs-Roswell, GA | 361,550 | 131.78 | 0.99 | $19.37 | $40,300 |
| Washington-Arlington-Alexandria, DC-VA-MD-WV | 358,860 | 112.87 | 0.85 | $23.21 | $48,270 |
| Boston-Cambridge-Nashua, MA-NH | 345,570 | 123.51 | 0.93 | $23.61 | $49,100 |
Metropolitan areas with the highest concentration of jobs and location quotients in this occupation:
| Metropolitan area | Employment (1) | Employment per thousand jobs | Location quotient (9) | Hourly mean wage | Annual mean wage (2) |
|---|---|---|---|---|---|
| Laredo, TX | 18,910 | 181.11 | 1.36 | $15.47 | $32,180 |
| Jefferson City, MO | 12,640 | 171.10 | 1.29 | $17.16 | $35,700 |
| Charleston, WV | 18,760 | 169.79 | 1.28 | $17.47 | $36,350 |
| Bloomsburg-Berwick, PA | 6,720 | 166.82 | 1.25 | $17.62 | $36,650 |
| El Paso, TX | 52,300 | 166.18 | 1.25 | $15.14 | $31,490 |
| Lewiston-Auburn, ME | 8,190 | 164.21 | 1.24 | $17.87 | $37,170 |
| Johnson City, TN | 12,500 | 161.16 | 1.21 | $15.72 | $32,700 |
| Carson City, NV | 4,760 | 161.09 | 1.21 | $19.47 | $40,500 |
| Jacksonville, FL | 112,880 | 160.54 | 1.21 | $18.65 | $38,790 |
| Grants Pass, OR | 4,270 | 160.44 | 1.21 | $17.23 | $35,840 |
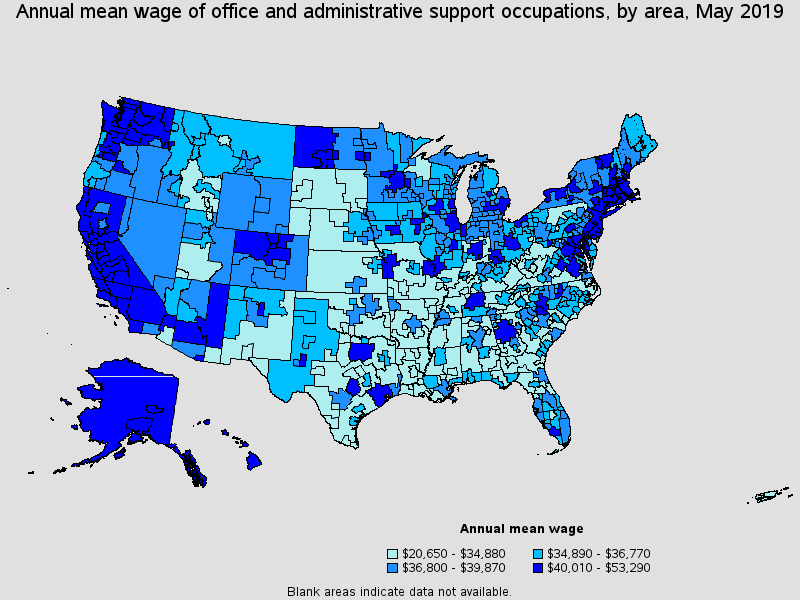
Top paying metropolitan areas for this occupation:
| Metropolitan area | Employment (1) | Employment per thousand jobs | Location quotient (9) | Hourly mean wage | Annual mean wage (2) |
|---|---|---|---|---|---|
| San Francisco-Oakland-Hayward, CA | 284,830 | 115.22 | 0.87 | $25.62 | $53,290 |
| San Jose-Sunnyvale-Santa Clara, CA | 125,160 | 109.71 | 0.83 | $25.12 | $52,250 |
| Bridgeport-Stamford-Norwalk, CT | 56,530 | 136.59 | 1.03 | $24.38 | $50,700 |
| Boston-Cambridge-Nashua, MA-NH | 345,570 | 123.51 | 0.93 | $23.61 | $49,100 |
| Napa, CA | 7,700 | 99.58 | 0.75 | $23.28 | $48,420 |
| Washington-Arlington-Alexandria, DC-VA-MD-WV | 358,860 | 112.87 | 0.85 | $23.21 | $48,270 |
| Seattle-Tacoma-Bellevue, WA | 232,540 | 115.06 | 0.87 | $23.16 | $48,180 |
| New York-Newark-Jersey City, NY-NJ-PA | 1,356,000 | 140.44 | 1.06 | $22.98 | $47,790 |
| Hartford-West Hartford-East Hartford, CT | 79,310 | 135.79 | 1.02 | $22.62 | $47,050 |
| New Haven, CT | 39,070 | 137.25 | 1.03 | $22.34 | $46,480 |
Nonmetropolitan areas with the highest employment in this occupation:
| Nonmetropolitan area | Employment (1) | Employment per thousand jobs | Location quotient (9) | Hourly mean wage | Annual mean wage (2) |
|---|---|---|---|---|---|
| Kansas nonmetropolitan area | 50,970 | 129.35 | 0.97 | $16.29 | $33,890 |
| North Northeastern Ohio non-metropolitan area (non-contiguous) | 39,870 | 119.32 | 0.90 | $16.87 | $35,090 |
| North Texas Region of Texas nonmetropolitan area | 35,830 | 129.47 | 0.97 | $16.44 | $34,200 |
| Balance of Lower Peninsula of Michigan nonmetropolitan area | 32,200 | 117.88 | 0.89 | $17.73 | $36,870 |
| Northeast Mississippi nonmetropolitan area | 31,860 | 135.81 | 1.02 | $15.49 | $32,230 |
Nonmetropolitan areas with the highest concentration of jobs and location quotients in this occupation:
| Nonmetropolitan area | Employment (1) | Employment per thousand jobs | Location quotient (9) | Hourly mean wage | Annual mean wage (2) |
|---|---|---|---|---|---|
| Central New Hampshire nonmetropolitan area | 14,340 | 148.35 | 1.12 | $19.12 | $39,780 |
| Big Thicket Region of Texas nonmetropolitan area | 15,590 | 146.53 | 1.10 | $15.54 | $32,320 |
| South Central Kentucky nonmetropolitan area | 24,680 | 144.76 | 1.09 | $15.38 | $32,000 |
| Arizona nonmetropolitan area | 12,870 | 139.73 | 1.05 | $19.79 | $41,170 |
| Northwest Lower Peninsula of Michigan nonmetropolitan area | 17,120 | 138.34 | 1.04 | $18.12 | $37,700 |
Top paying nonmetropolitan areas for this occupation:
| Nonmetropolitan area | Employment (1) | Employment per thousand jobs | Location quotient (9) | Hourly mean wage | Annual mean wage (2) |
|---|---|---|---|---|---|
| Alaska nonmetropolitan area | 14,770 | 136.15 | 1.02 | $22.44 | $46,680 |
| Massachusetts nonmetropolitan area | 7,280 | 119.78 | 0.90 | $21.08 | $43,860 |
| Connecticut nonmetropolitan area | 4,430 | 136.20 | 1.02 | $21.07 | $43,820 |
| Northwest Colorado nonmetropolitan area | 13,660 | 111.16 | 0.84 | $20.74 | $43,130 |
| West North Dakota nonmetropolitan area | 13,200 | 105.04 | 0.79 | $20.49 | $42,620 |
These estimates are calculated with data collected from employers in all industry sectors, all metropolitan and nonmetropolitan areas, and all states and the District of Columbia.
The percentile wage estimate is the value of a wage below which a certain percent of workers fall. The median wage is the 50th percentile wage estimate--50 percent of workers earn less than the median and 50 percent of workers earn more than the median. More about percentile wages.
(1) Estimates for detailed occupations do not sum to the totals because the totals include occupations not shown separately. Estimates do not include self-employed workers.
(2) Annual wages have been calculated by multiplying the hourly mean wage by a "year-round, full-time" hours figure of 2,080 hours; for those occupations where there is not an hourly wage published, the annual wage has been directly calculated from the reported survey data.
(3) The relative standard error (RSE) is a measure of the reliability of a survey statistic. The smaller the relative standard error, the more precise the estimate.
(9) The location quotient is the ratio of the area concentration of occupational employment to the national average concentration. A location quotient greater than one indicates the occupation has a higher share of employment than average, and a location quotient less than one indicates the occupation is less prevalent in the area than average.
Other OES estimates and related information:
May 2019 National Occupational Employment and Wage Estimates
May 2019 State Occupational Employment and Wage Estimates
May 2019 Metropolitan and Nonmetropolitan Area Occupational Employment and Wage Estimates
May 2019 National Industry-Specific Occupational Employment and Wage Estimates
Last Modified Date: July 6, 2020