Department of Labor Logo United States Department of Labor
Dot gov

The .gov means it's official.
Federal government websites often end in .gov or .mil. Before sharing sensitive information, make sure you're on a federal government site.

Https

The site is secure.
The https:// ensures that you are connecting to the official website and that any information you provide is encrypted and transmitted securely.

BLS Information
PRINT:Print

Information Guide

bls logo
Information Guide

Introduction

Mission

The Bureau of Labor Statistics (BLS) is an agency of the United States Department of Labor. It is the principal fact-finding agency in the broad field of labor economics and statistics and serves as part of the U.S. Federal Statistical System. BLS collects, calculates, analyzes, and publishes data essential to the public, employers, researchers, and government organizations. The Bureau of Labor Statistics measures labor market activity, working conditions, price changes, and productivity in the U.S. economy to support public and private decision making.

About The BLS Information Guide

To make it easier for you to request information or data, we provide:

  • Descriptions of the information and data we produce
  • Descriptions of BLS publications
  • Instructions for accessing information and data through the internet, email, and phone
  • Names and telephone numbers of people to contact for more information

If you have any comments about the BLS Information Guide, please contact us.

Where you can obtain information from BLS

Internet

  • Our website is the gateway to all BLS data, www.bls.gov.
  • You can join our subscription service to receive free email updates of selected news releases, new publications, or specific data summaries.
  • Follow us on Twitter/X @BLS_gov to receive up-to-date information on the U.S. economy.
  • Visit our Help & Tutorials web page to guide you in using data tools and other features.

Phone

BLS representatives can help you access data and information produced by BLS. You can reach us at 202-692-5200.

Recorded phone messages

Recorded summaries of current BLS data are available on telephone hotlines 24 hours a day, 7 days a week. Please call our regional offices to listen to recorded summaries of BLS data.

  • Northeast Region, 646-264-3600
  • Mid-Atlantic Region, 215-597-3282
  • Midwest Region, 312-353-1880
  • Mountain-Plains Region, 816-285-7000
  • Southeast Region, 404-893-4222
  • Southwest Region, 972-850-4800
  • Western Region, 415-625-2270

BLS publications

Current data and analyses are available online in news releases, articles, reports, and chart presentations. Printed copies of older BLS publications usually can be found at federal depository libraries. You can check with your local librarian or find the federal depository library nearest you through the Government Publishing Office. Another resource for older publications is the St. Louis Federal Reserve Bank’s FRASER digital library.

News releases

BLS news releases announce that new data and information are available. They typically consist of a short narrative with at least one chart. See our full list of news releases.

Monthly Labor Review

The Monthly Labor Review (MLR) was established in 1915 and is the principal journal of fact, analysis, and research published by BLS. BLS economists, statisticians, and data scientists join with academic researchers, private sector professionals, and state and local government specialists to provide a wealth of research in a wide variety of fields: the labor force, the economy, employment, inflation, productivity, workplace injuries and illnesses, pay and benefits, working conditions, prices, and more.

BLS does consider papers written by non-BLS authors for publication in the MLR. See our submission guidelines to learn more. Authors may submit papers for consideration by email to the Executive Editor, at OPUBSS_Submit@bls.gov.

Beyond the Numbers

Beyond the Numbers features current, brief analyses that allow BLS economists to highlight interesting topics on employment and unemployment, prices and spending, global economy, pay and benefits, workplace injuries, productivity, and special studies and research.

Occupational Outlook Handbook

The Occupational Outlook Handbook (OOH) offers a detailed look at the projected employment growth for occupations, as well as pay and education and training. It is a nationally recognized source of career information, and the OOH is designed to provide valuable assistance to individuals making decisions about their future work lives.

Career Outlook

Career Outlook features articles and brief summaries on employment, earnings, education and training needs, and careers. Each issue is designed to help guidance counselors, career planners, employment analysts, and young people keep up with occupational employment developments in a fast-changing economy.

TED: The Economics Daily

TED: The Economics Daily presents fresh economic information in charts and maps and highlights intriguing BLS data that you might otherwise have missed.

Spotlight on Statistics

Spotlight on Statistics features graphics, maps, and brief analysis to illustrate BLS data about the U.S. labor market and economy.

Commissioner’s Corner

Commissioner’s Corner is a blog where we announce new products and research and explain things you might not have known about BLS data.

BLS Reports

BLS Reports provide data on women in the labor force, labor force characteristics by race and ethnicity, the working poor, and consumer expenditures. They typically contain a few pages of analysis and numerous tables.

Handbook of Methods

The Handbook of Methods provides the most current and detailed explanations of how BLS obtains and prepares the economic data it publishes.

Are you searching for a specific topic or a definition of a BLS term? Please see our A-Z Index and Glossary.

Classroom Resources for K–12 Teachers

BLS has a webpage devoted to helping students and teachers discover information about the economy and jobs. The Classroom webpage is a fun way to learn about BLS and the data we produce; it was created with students from kindergarten through 12th grade in mind.

The Teacher’s Desk has classroom activities and videos you can incorporate into your lesson plans to explain common economic concepts using BLS data! The Teacher’s Desk also has informational posters to print and hang in your classroom and around the school. These posters feature the fastest growing occupations, employment growth and pay for occupational groups, employment and earnings by educational attainment, and much more. We update these posters when we publish new data.

On the Student’s Desk you can explore careers that relate to your interests and learn about the economic concepts BLS uses. You can also make your own data chart using our K–12 Chart Maker tool!

You can test your knowledge of BLS concepts with our Games & Quizzes.

You can contact us to learn more about the K–12 webpage or to send us your feedback.

How to Contact Information Providers

Information specialists in the following offices are available to assist you:

  • BLS Division of Information and Marketing Services, Washington, DC

    • The BLS Division of Information and Marketing Services disseminates BLS information to businesses, government agencies, and the public. Our staff are available from 8:30 a.m. to 4:30 p.m., Eastern Time, to answer a full range of questions regarding BLS data and information.

      The Division of Information and Marketing Services offers the following services:

      • Personal assistance by staff
      • Online subscriptions to selected publications
      • Speakers available to conduct workshops and seminars on BLS programs
      • Access to archived BLS publications

      You can contact the Division of Information and Marketing Services by mail at the address below.

      U.S. Bureau of Labor Statistics

      Division of Information and Marketing Services

      2 Massachusetts Avenue NE, Room 2850

      Washington, DC 20212

  • BLS Regional Economic Analysis and Information offices
    • BLS Regional Economic Analysis and Information Offices

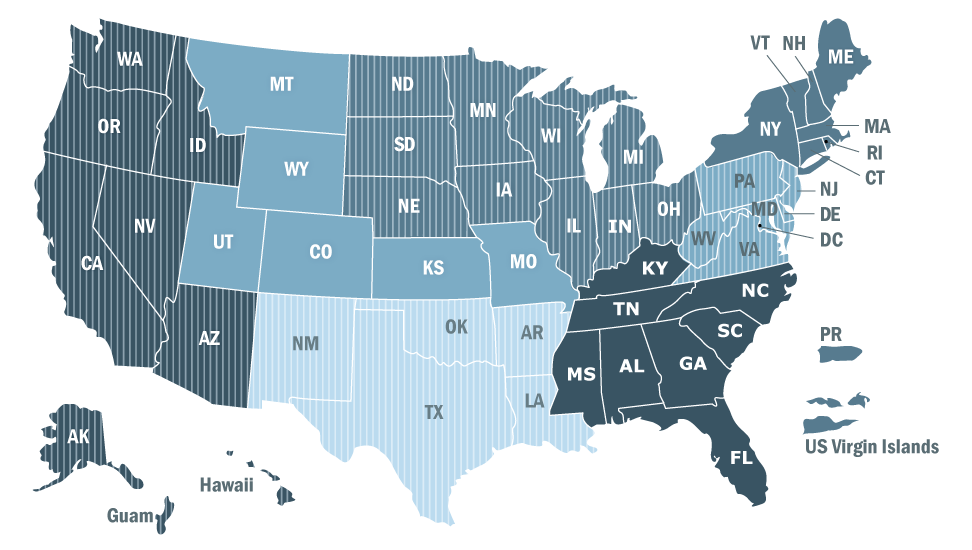
      Regional information offices analyze and publish BLS data and help customers with questions about the application and use of those data. Although these offices specialize in the regional economy, they provide the full range of BLS statistics and publications to all customers, including businesses, government agencies, and the public. BLS has seven regional information offices.

      Regional information offices offer the following:

      • Recorded messages
      • Consultations with, and assistance from, BLS economists
      • Regional economic analysis on labor markets and prices
      • Speakers available to conduct workshops and seminars on BLS programs and information services

      Northeast

      Connecticut – Maine – Massachusetts – New Hampshire – Rhode Island – Vermont – New York – Puerto Rico – U.S. Virgin Islands

      Mid-Atlantic

      Delaware – District of Columbia – Maryland – New Jersey – Pennsylvania – Virginia – West Virginia

      Southeast

      Alabama – Florida – Georgia – Kentucky – Mississippi –North Carolina – South Carolina – Tennessee

      Midwest

      Illinois – Indiana – Iowa – Michigan – Minnesota – Nebraska – North Dakota – Ohio – South Dakota – Wisconsin

      Southwest-Mountain-Plains

      Arkansas – Colorado – Kansas – Louisiana – Missouri – Montana – New Mexico – Oklahoma – Texas Utah – Wyoming – Colorado – Kansas – Missouri – Montana – Utah – Wyoming

      West

      Alaska – Arizona – California – Hawaii – Idaho – Nevada – Oregon – Washington

  • State offices providing labor market information and workplace injuries, illnesses, and fatalities statistics

What Topics Are You Interested In?

Careers And Occupations

Employment Projections

Provides information about the labor market, education, training, and job qualifications

Key Takeaways:
  • The Employment Projections program develops information about the labor market for the nation as a whole for 10 years in the future. 

  • Projections of employment by industry and occupation are used for career decision purposes by students, parents, counselors, dislocated workers, jobseekers, and career changers. 

  • Projections are also a critical component of workforce development systems and serve as the basis for determining jobs in demand. 

  • The Employment Projections program also provides information on the education and training requirements for entering occupations to aide in career exploration.

  • The Employment Projections program develops the Occupational Outlook Handbook, which is a web-based publication that provides information on the type of work; education, training, and other qualifications; employment; job outlook; wages; similar occupations; and sources of additional information for hundreds of occupations. 

News releases:
Data available:
Similar to Employment Projections:

Occupational Employment and Wage Statistics, Current Population Survey, Current Employment Statistics, Occupational Requirements Survey

Occupational Employment and Wage Statistics

Produces employment and wage estimates annually

Key Takeaways:
  • The Occupational Employment and Wage Statistics (OEWS) program produces employment and wage estimates annually for approximately 830 occupations.
  • These estimates are available for the nation as a whole, for individual States, for metropolitan and nonmetropolitan areas, and territories.
  • National occupational estimates for specific industries are also available.
News releases:
Data available:
Similar to OEWS:

Employer Costs for Employee Compensation, Employment Projections, Occupational Outlook Handbook, Current Population Survey, Current Employment Statistics, Quarterly Census of Employment and Wages, Injuries, Illnesses, and Fatalities

Occupational Requirements Survey

A survey on job requirements, conditions, and demands

Key Takeaways:
  • The Occupational Requirements Survey (ORS) provides job-related information regarding physical demands; environmental conditions; education, training, and experience; as well as cognitive and mental requirements for jobs in the U.S. economy.
  • The ORS is conducted by the Bureau of Labor Statistics under an agreement with the Social Security Administration.
News releases:
Data available:
  • Physical demands of work (such as keyboarding, reaching overhead, lifting or carrying)
  • Environmental conditions (such as extreme heat, exposure to outdoors, proximity to moving parts)
  • Education, training, and experience requirements (literacy, credentials, on-the-job training)
  • Cognitive and mental requirements of work (interaction with the general public, working around crowds, work pace)
Similar to ORS:

Employment Projections, Occupational Outlook Handbook

Standard Occupational Classification

A standard used by federal agencies to classify workers into occupational categories

Resources available:
  • Information on the 2018, 2010, and 2000 Standard Occupational Classification (SOC) systems
  • Manuals, user guides, SOC definitions, and other resources
  • These 867 detailed occupations are combined to form 459 broad occupations, 98 minor groups, and 23 major groups.
Recent notices:
Resources available:
  • Information on the 2018, 2010, and 2000 SOC systems
  • Manuals, user guides, SOC definitions, and other resources
Similar to ORS:

Occupational Employment and Wage Statistics

Consumer Spending

Consumer Expenditure Surveys

Nationwide household surveys to study how U.S. consumers spend their money

Key Takeaways:
  • A standard set of Consumer Expenditure tables are published each year, which include income quintile, income decile, income class, age of reference person, generation of reference person, selected age ranges of reference person, size of consumer unit, number of earners, composition of the consumer unit, census region of residence, population size of area, housing tenure, race, Hispanic origin, occupation, highest education level of any member, and type of area (urban or rural).
  • Microdata are available in two formats: public use microdata (PUMD) and restricted microdata. Both types are available for the Diary and Interview Surveys and contain expenditure and income data for each consumer unit.
  • The database provides tools to access historical data from 1984 onward to produce trends in expenditures by demographic groups.
Recent news release:
Data available:
  • Tables with average annual expenditure means and relative share
  • Public use microdata
Similar to Consumer Expenditures:

Consumer Price Index, Bureau of Economic Analysis (Consumer Spending)

Demographic Statistics

Current Population Survey

A survey of the labor force characteristics of households in the United States

Key Takeaways:
  • The Current Population Survey (CPS), a monthly survey of about 60,000 households that the U.S. Census Bureau conducts for the Bureau of Labor Statistics, provides a comprehensive body of information on the employment and unemployment experience of the nation’s population, classified by age, sex, race, ethnicity, education, and other characteristics.
  • The CPS is the source of data on the national unemployment rate; employment by occupation; the labor force participation of mothers; usual weekly earnings; and many other demographic, social, and economic estimates.
News releases:
Data available:
  • Employment status
  • Characteristics of people in the labor force and people not in the labor force
  • Displaced workers
  • Women maintaining families and working women with children
  • Weekly and hourly earnings
  • Union membership
  • People with professional certifications and licenses
  • The working poor
  • Work experience
  • Tenure with current employer
  • Activities of recent high school graduates and dropouts
Similar to CPS:

Local Area Unemployment Statistics, Current Employment Statistics, American Time Use Survey

National Longitudinal Surveys

A set of surveys designed to gather information at multiple points in time on the labor market activities and other significant life events of several groups of men and women. NLS data have served as an important tool for economists, sociologists, and other researchers for more than 50 years.

Key Takeaways:
  • The National Longitudinal Surveys (NLS) are a series of surveys that gather information on the work and life experiences of groups of Americans, called cohorts, born during specific periods, at multiple points in time.
  • Each of the NLS cohorts (for example, older Millennials) consists of several thousand sample members, some of whom have been surveyed for decades. These data offer the opportunity to study specific groups of Americans over long periods of their lives.
News releases:
Data available:
  • Number of jobs held over time
  • Transitions from school to career
  • Transitions from military to civilian life
  • How earnings grow at different stages of workers’ careers
  • Changes in marital, partner, and other family relationships
  • How health conditions relate to labor market activity
Active surveys:
Similar to NLS:

Current Population Survey, American Time Use Survey

Employment Statistics

Current Employment Statistics — National Estimates

Detailed national industry estimates of nonfarm employment, hours, and earnings of workers on payrolls

Key Takeaways:
  • The Current Employment Statistics (CES) survey provides employment, hours, and earnings estimates based on payroll records of business establishments.
  • Payroll employment data are published for both private and government sectors.
  • Employment data by aggregate industry sector and most major industry sectors are published as far back as 1939.
News releases:
Data available:
  • Nonfarm employment series for all employees, production and nonsupervisory employees, and women employees
  • Average hourly earnings, average weekly hours, and average weekly overtime hours (in manufacturing industries) for all employees and production and nonsupervisory employees
Similar to CES:

Current Population Survey, State and Metro Area Employment, Hours, and Earnings

Geographic Information

Local Area Unemployment Statistics

Monthly estimates of total employment and unemployment for over 7,600 areas

Key Takeaways:
  • Monthly and annual employment, unemployment, and labor force data for census regions and divisions, states, counties, metropolitan areas, and many cities, by place of residence.
  • Federal programs use the data for allocations to states and areas, as well as eligibility determinations for assistance.
  • State and local governments use the estimates for planning and budgetary purposes and to determine the need for local employment and training services.
  • Private industry, researchers, the media, and others use the data to assess localized labor market developments and make comparisons across areas.
News releases:
Data available:
  • Employment status
  • Characteristics of people in the labor and people not in the labor force
Similar to Local Area Unemployment Statistics:

Current Population Survey, Current Employment Statistics (National), State and Metro Area Employment, Hours, & Earnings

Quarterly Census of Employment and Wages 

Publishes a quarterly count of employment, wages, and establishments

Key Takeaways:
  • The Quarterly Census of Employment and Wages (QCEW) program publishes data on employment and wages covering more than 95 percent of U.S. jobs.
  • Data are available at the county, metropolitan statistical area, state, and national levels by industry.
  • QCEW produces a comprehensive tabulation of data on the number of establishments, monthly employment and quarterly wages for workers covered by state unemployment insurance laws and federal workers covered by the Unemployment Compensation for Federal Employees program.
  • Employment and wage data developed in the QCEW program have been classified by industry since 1938.
News releases:
Data available:
  • Databases of state and county employment and wages
  • Interactive charts
  • Customized maps of QCEW data
Similar to QCEW:

Current Employment Statistics, Business Employment Dynamics

State and Metro Area Employment, Hours, and Earnings

Produces detailed industry estimates of employment, hours, and earnings of workers on nonfarm payrolls

Key Takeaways:
  • The State and Metro Area Employment, Hours, and Earnings (SAE) is a federal and state cooperative program that provides industry estimates of employment, hours, and earnings for all U.S. States, the District of Columbia, Puerto Rico, the U.S. Virgin Islands, and about 450 metropolitan areas and divisions.
  • Program estimates are among the earliest economic information available to analyze current economic conditions.
  • Data are collected, tabulated, and distributed to provide economic data to policy makers, business, labor, and the public.
News releases:
Data available:
  • All employees, by major industry sector and by selected two- and three-digit North American Industry Classification System (NAICS) codes, for each U.S. State, the District of Columbia, Puerto Rico, the U.S. Virgin Islands, and about 450 metropolitan areas and metropolitan divisions
  • Production or nonsupervisory employees, by sector and by selected two- and three-digit NAICS codes, for many U.S. States, Puerto Rico, and select metropolitan areas and metropolitan divisions
  • Average hours and earnings of all employees, by NAICS supersector, in each U.S. State and the District of Columbia, and at the total private level for metropolitan areas and metropolitan divisions
  • Three-month average change in all employees at the total nonfarm and total private level for each U.S. State, the District of Columbia, Puerto Rico, and the U.S. Virgin Islands
  • Three-month average change at the total private level for select metropolitan areas and metropolitan divisions
Similar to SAE:

Current Employment Statistics (National), Local Area Unemployment Statistics, Quarterly Census of Employment and Wages

How Americans Spend Their Time

American Time Use Survey

Measures the amount of time people spend doing various activities, such as paid work, childcare, volunteering, and socializing

Key Takeaways:
  • The American Time Use Survey (ATUS) provides nationally representative estimates of how, where, and with whom Americans spend their time.
  • The ATUS is the only federal survey providing data on the full range of nonmarket activities, including work, education, sleep, childcare, eldercare, leisure, volunteering, and other activities. 
  • Interviewers ask each respondent to recall their activities over a full 24-hour day, beginning at 4 a.m. on the day prior to the interview and ending at 4 a.m. on the day of the interview.
News releases:
Data available:
  • Data for demographic groups (age, sex, race, ethnicity, and educational attainment)
  • Data by employment status, occupation, class of worker, earnings, marital status, presence and age of household children, school enrollment status, weekdays, and weekend days
  • Quarterly and annual average data on the number of hours per day spent in various activities by the population
  • Annual average data on the percentage of the population that engaged in various activities on an average day
Similar to ATUS:

Current Population Survey, Consumer Expenditure Survey, National Longitudinal Survey

Inflation And Prices

Consumer Price Index

A measure of the average change over time in the prices paid by urban consumers for a market basket of consumer goods and services

Key Takeaways:
  • The Consumer Price Index (CPI) represents changes in prices of all goods and services purchased for consumption by urban households. User fees (such as water and sewer service) and sales and excise taxes paid by the consumer are also included. Income taxes and investment items (like stocks, bonds, and life insurance) are not included.
  • The Consumer Price Index for All Urban Consumers (CPI-U) includes expenditures by urban wage earners and clerical workers, professional, managerial, and technical workers, the self-employed, short-term workers, the unemployed, retirees, and others not in the labor force.
  • The Consumer Price Index for Urban Wage Earners and Clerical Workers (CPI-W) includes only expenditures by those in hourly wage earning or clerical jobs.
  • Prices for the goods and services used to calculate the CPI are collected in 75 urban areas throughout the country and from about 23,000 retail and service establishments. Data on rents are collected from about 50,000 landlords or tenants.
News release:
Data available:
  • Price indexes are available for the United States, the four Census regions, nine Census divisions, two size of city classes, eight cross-classifications of regions and size-classes, and for 23 local areas.
  • Indexes are available for major groups of consumer expenditures (food and beverages, housing, apparel, transportation, medical care, recreation, education and communications, and other goods and services), for items within each group, and for special categories, such as services.
  • Monthly indexes are available for the United States, the four Census regions, and some local areas.
  • Indexes are available for two population groups: the CPI-U which covers over 90 percent of the total population and the CPI-W which covers approximately 30 percent of the population.
  • The Chained Consumer Price Index for All Urban Consumers (C-CPI-U) is based on the same population group as the CPI-U but uses a different formula and monthly weights.
Similar to CPI:

Producer Price Indexes, Consumer Expenditure Surveys, Import/Export Price Indexes

U.S. Import and Export Price Indexes

A measure of the prices of nonmilitary goods and services traded between the United States and the rest of the world

Key Takeaways:
  • U.S. Import and Export Price Indexes measure the average change in prices over time for most imported and exported goods, as well as for selected categories of services, between the United States and the rest of the world.
  • Import price indexes are available by locality of origin for select countries, regions, and groupings.
  • Quarterly data are available from December 1990 to June 1992 and monthly data since September 1992.
  • Items are classified, respectively, by end use for the Bureau of Economic Analysis System, by industry for the North American Industry Classification System, and by product category for the Harmonized System.
News release:
Data available:
  • Price indexes for nearly all categories of merchandise goods
  • Price indexes for selected categories of international transportation services
  • Locality of origin import and export price indexes for selected regions and countries
  • Terms of trade indexes for selected regions and countries
Similar to Import and Export Price Indexes:

Producer Price Indexes, Consumer Price Index

Producer Price Index

A measure of the average change over time of the selling prices received by domestic producers for their output

Key Takeaways:
  • The Producer Price Indexes (PPI) are a family of indexes that measure the average change over time in selling prices received by domestic producers of goods, services, and nonresidential building construction.
  • About 10,000 indexes for individual products and groups of products are released each month. Indexes are available for the output of nearly all industries in the goods-producing sector of the U.S. economy.
  • The PPI program covers approximately 69 percent of the service sector's output, as measured by revenue reported in the 2017 Economic Census. 
News release:
Data available:
  • Industry classification: These indexes measure changes in prices received for an industry's output sold outside the industry.
  • Commodity classification: These indexes measure changes in prices for products of similar composition, regardless of the industry of the producing establishment.
  • Commodity-based Final Demand-Intermediate Demand (FD-ID) System: FD-ID price indexes and the amount of physical processing or assembling the products have undergone.
  • Net input to industry indexes: These indexes measure changes in input prices for selected industries, excluding capital investment, labor, and imports.
Similar to PPI:

Consumer Price Index, Import/Export Price Indexes

International Partnerships

International Technical Cooperation

Assists statistical organizations throughout the world with the collection, processing, analysis, dissemination, and use of economic and labor statistics

Key Takeaways:
  • International Technical Cooperation (ITC) offers seminars on various topics related to labor market indicators, price indexes, and productivity for staff working in national statistical offices and international organizations. 
  • Seminars include lectures, discussions, and workshops, and they are designed to strengthen the participants’ ability to collect and analyze economic and labor statistics. 
  • Seminars are scheduled for groups of three or more, upon request, and may be conducted at the National Office of the U.S. Bureau of Labor Statistics, overseas, or virtually. 
  • U.S. Bureau of Labor Statistics subject matter experts can be made available to serve as consultants and may assist staff working in national statistical offices and international organizations to improve or implement labor statistics and price programs. 
  • ITC also arranges short-term meetings for international visitors with subject matter experts from the U.S. Bureau of Labor Statistics. Meetings are organized to meet the needs and interests of the visitors and may be scheduled virtually or in-person. 
Consultations:
  • The U.S. Bureau of Labor Statistics makes available technical experts to serve as consultants. To request a consultation, please submit an online inquiry. Requests should include a clear statement of the purpose of the consultation.
Seminars:
  • The U.S. Bureau of Labor Statistics conducts seminars at its training facilities in Washington, D.C. for groups of three or more, upon request.
  • International training seminars bring together statisticians, economists, analysts, and other data users from countries all over the world. Each seminar includes lectures, discussions, and workshops.
Seminar Programs:

Job Vacancies Hiring And Separations

Business Employment Dynamics

Statistics about dynamic job gains and losses  

Key Takeaways:
  • Business Employment Statistics (BED) are statistics generated from the Quarterly Census of Employment and Wages program.
  • These quarterly data series consist of gross job gains and gross job losses statistics from 1992 forward.
  • These data provide a picture of the dynamic state of the labor market. 
News release:
Data available:
  • Data on gross job gains, gross job losses, and their respective components are available for the private sector.
  • Data are available for industries.
Similar to BED:

Quarterly Census of Employment and Wages, Job Openings and Labor Turnover Survey, Current Employment Statistics (National)

Job Openings and Labor Turnover Survey

Produces data on job openings, hires, and separations 

Key Takeaways:
  • The Job Openings and Labor Turnover Survey (JOLTS) collects information on labor demand and labor turnover from approximately 21,000 nonfarm establishments monthly.
  • The JOLTS program produces monthly and annual estimates of the levels and rates of job openings, hires, total separations, quits, layoffs, discharges, retirements, transfers, and deaths.
News release:
Data available:
  • Monthly and annual average levels and rates for job vacancies, hires, and separations
  • Estimates for total nonfarm, total private, industries, and government
  • Estimates for the nation, U.S. census regions, states, and the District of Columbia
  • Estimates for establishment size classes
  • Unemployed persons per job opening
Similar to JOLTS:

Business Employment Dynamics, Current Employment Statistics (National), State and Metro Area Employment, Hours, and Earnings Current Population Survey, Local Area Unemployment Statistics

Pay And Benefits

Employee Benefits Survey

Data on selected employee benefit plans

Key Takeaways:
  • The Employee Benefits Survey (EBS) provides data on the percentage of workers with access to and participating in employer provided benefit plans, as well as details of what those plans provide.
  • Data are published on the incidence and detailed provisions of vacation, paid holidays, sick leave, nonproduction bonuses, life insurance plans, health insurance, short-term and long-term disability insurance, health savings accounts, wellness benefits, retirement benefits, and other benefit plans. Employer and employee shares of contributions to medical care premiums and their average amounts are also presented.
  • Data are published on the provisions on health and retirement plans. These include plan features, costs, and limitations or restrictions for health and retirement plans.
News releases:
Data available:
  • Rates of access to, and participation in, life insurance, health insurance, short- and long-term disability insurance, and retirement plans (defined benefit and defined contribution), along with plan provisions
  • Rates of access to, and plan provisions of, paid holidays and vacations
  • Rates of access to jury duty pay, military leave, employer assistance for childcare, long-term care insurance, flexible worksites, subsidized commuting, stock options, and types of nonproduction bonuses
  • Details of employer-sponsored health and retirement plans
Similar to EBS:

Employer Costs for Employee Compensation, Employment Cost Index

Employer Costs for Employee Compensation

Measures the average employer cost per employee hour worked for total compensation, wages and salaries, and benefits, and costs as a percent of total compensation

Key Takeaways:
  • Employer Costs for Employee Compensation (ECEC) provide a snapshot of the structure of compensation at points in time. That is, ECEC shows the distribution of employer costs among the components of compensation: wages and salaries and employee benefits, which include paid vacations, health insurance, retirement plans, and Social Security.
News releases:
Data available:
  • Estimates of total compensation for March, June, September, and December
  • Wages and salaries and benefits costs for civilian, private industry, and state and local government workers
  • Occupational groups
  • Industry groups
  • Collective bargaining status
  • Geographic area
Similar to ECEC:

Employment Cost Index, Modeled Wage Estimates, Employee BenefitsOccupational Employment and Wage StatisticsQuarterly Census of Employment and Wages

Employment Cost Index

Measures changes in labor costs over time

Key Takeaways:
  • The Employment Cost Index (ECI) uses a fixed “basket” of labor (the same number of welders, teachers, accountants, etc. in the same industries and areas) to produce a cost change that is free from the effects of workers moving between areas and industries.
News releases:
Data available:
  • 3-month and 12-month percent changes in total compensation
  • Percent changes in wages and salaries and benefits costs for civilian, private industry, and state and local government workers
  • Occupational groups
  • Industry groups
  • Collective bargaining status
  • Geographic area
Similar to ECI:

Consumer Price Index, Modeled Wage Estimates, Occupational Employment and Wage Statistics, Productivity, Quarterly Census of Employment and Wages, Current Employment Statistics, Employer Costs for Employee Compensation

Modeled Wage Estimates

Annual estimates of average hourly wages for occupations by selected job characteristics and geographic location

Key Takeaways:
  • Modeled Wage Estimates are produced annually using a statistical procedure that combines survey data collected by the National Compensation Survey and the Occupational Employment and Wage Statistics program. Borrowing from the strengths of both surveys, the Modeled Wage Estimates provide more detail on average hourly wages than either program is able to provide separately.
  • Modeled Wage Estimates provide average hourly wages for occupations by job characteristics and within a given geographic location.
  •  The job characteristics include all workers, bargaining status (union and nonunion), work status (part time and full time), basis of pay (incentive based and time based), and work levels (1–15 and unable to be leveled). Work levels are measures of duties and responsibilities that apply to occupations.
  • The geographic areas include national, state, and metropolitan and nonmetropolitan areas.
Recent publication:
Data available:
Similar to Modeled Wage Estimates:

Occupational Employment and Wage Statistics, Employer Costs for Employee Compensation

Productivity

Productivity

Measures how efficiently the United States converts inputs into the outputs of goods and services  

Key Takeaways:
  • Productivity is used as a measure to determine economic efficiency and is a significant source of potential growth in gross domestic product (GDP) and national income.
  • Productivity measures can assess the economy’s ability to expand output without additional inputs and, thus, its ability to increase living standards and improve competitiveness.
  • Labor productivity measures the growth in output that is not a result of adding additional labor hours.
  • Total factor productivity measures the growth in output that is not a result of adding more measured inputs (hours, capital, purchased energy, materials, or services) and is often consider an indicator of technical change.
News release:
Data available:
  • Productivity: labor productivity (output per hour), total factor productivity, output per worker 
  • Output
  • Labor: hours worked, average weekly hours, employment, labor composition
  • Costs: labor compensation, hourly compensation, unit labor costs, price deflators, profits, rental prices, input costs
  • Inputs to production: capital intensity, capital services, energy, materials, services, combined inputs, input costs and cost shares, capital asset categories and related measures, research and development, intellectual property products, and contributions of inputs to productivity
Similar to Productivity:

Productivity Research and Program Development, Current Employment Statistics (National), Quarterly Census of Employment and Wages

Workplace Injuries And Illnesses

Injuries, Illnesses, and Fatalities

Produces a wide range of information about workplace injuries and illnesses

Key Takeaways:
  • The Injuries, Illnesses, and Fatalities (IIF) program produces information about U.S. workplace injuries and illnesses.
  • The program collects data from private and public sector establishments and releases estimates annually.  
  • Nonfatal and fatal data are available nationally and for participating states.    
  • Nonfatal estimates include counts and rates of workplace injuries and illnesses by industry and type of case. 
  • The IIF program produces detailed information about injury or illness circumstances and worker demographics for cases involving days away from work. 
  • The IIF program provides detailed information on fatal workplace injuries, including industry and occupation data, case circumstances, and worker characteristics. 
News releases:
Data available:
Similar to IIF:

Occupational Requirements Survey

Work Stoppages

Work Stoppages Program

Provides data of major work stoppages

Key Takeaways:
  • The Work Stoppage Program (WSP) provides monthly and annual data of major work stoppages involving 1,000 or more workers lasting one full shift or longer.
  • Monthly and annual WSP data show the establishment and union(s) involved in the work stoppage along with the location, the number of workers, and the days of idleness.  
  • The monthly data list all work stoppages involving 1,000 or more workers that occurred during the full calendar month for each month of the year.  
  • The work stoppages data are gathered from public news sources, such as newspapers and the Internet. 
News releases:
Data available:
  • Number of work stoppages, beginning and in effect in the period
  • Number of workers involved, beginning and in effect in the period
  • Days of idleness, in effect in the period
  • Days of idleness, in effect as a percent of total estimated working time
  • Weekly and hourly earnings
Similar to WSP:

Current Employment Statistics Strike Report

Contact Information

Bureau of Labor Statistics

Contact BLS to reach national and regional BLS information offices which are available to help you find and use BLS data, publications, and services. Also, you will find the contact information for all the BLS programs if you need answers to specific questions about BLS data or its surveys.

Other Federal Organizations