
An official website of the United States government
 United States Department of Labor
An official website of the United States government
United States Department of Labor

The .gov means it's official.
Federal government websites often end in .gov or .mil. Before sharing sensitive information,
make sure you're on a federal government site.

The site is secure.
The
https:// ensures that you are connecting to the official website and that any
information you provide is encrypted and transmitted securely.


The Current Employment Statistics (CES) program produces detailed industry estimates of nonfarm employment, hours, and earnings of workers on payrolls. CES National Estimates produces data for the nation, and CES State and Metro Area produces estimates for all 50 States, the District of Columbia, Puerto Rico, the Virgin Islands, and about 450 metropolitan areas and divisions.
Each month, CES surveys approximately 119,000 businesses and government agencies, representing approximately 622,000 individual worksites.
- 1-month
- 3-month
- 6-month
- 12-month
Employment change by industry with confidence intervals, September 2026, seasonally adjusted, in thousands
Industry
1-month net change
1-month 90-percent confidence interval
3-month net change
3-month 90-percent confidence interval
6-month net change
6-month 90-percent confidence interval
12-month net change
12-month 90-percent confidence interval
Total nonfarm
29
122.3
152
168.9
394
215.2
496
280.8
Total private
46
113.0
163
156.3
400
198.6
712
260.4
Goods-producing
18
37.7
87
56.7
110
77.0
151
100.7
Service providing
11
115.4
65
159.6
284
198.6
345
260.4
Mining and logging
-2
5.0
-2
8.3
3
10.9
2
14.9
Construction
11
27.0
45
43.0
53
58.3
109
77.7
Manufacturing
9
22.4
44
33.6
54
46.6
40
63.5
Wholesale trade
5.0
19.7
19.3
29.0
27.0
39.2
26.5
50.0
Retail trade
5.8
18.1
6.3
26.1
44.4
42.9
26.5
53.0
Transportation and warehousing
7.6
20.0
21.2
32.0
51.1
44.0
-9.8
58.4
Utilities
0.5
2.1
3.7
3.4
5.7
6.3
10.1
9.3
Information
-10
15.2
-24
23.6
-54
32.3
-120
39.9
Financial activities
-7
17.8
-26
26.2
-50
33.5
-107
46.0
Professional and business services
-9
47.2
-20
66.8
42
81.4
123
97.8
Private education and health services
20
51.0
72
66.5
213
83.8
516
106.3
Leisure and hospitality
10
53.9
9
74.2
-10
94.5
62
115.6
Other services
6
21.3
15
27.4
21
34.9
34
40.8
Government
-17
46.7
-11
64.0
-6
82.9
-216
105.1
Note: Significant changes are calculated at a 90-percent confidence level. The variance for total nonfarm is an approximation because government and rail transportation are not based on a probability sample
10/02/2026
Both nonfarm payroll employment (+29,000) and the unemployment rate
(4.2 percent) changed little in September. Employment in all major
industries changed little over the month.
HTML
|
PDF
|
RSS
|
Charts
09/11/2026
Real average hourly earnings for all employees decreased 0.1 percent in August, seasonally adjusted. Average hourly earnings increased 0.3 percent, and CPI-U increased 0.4 percent. Real average weekly earnings increased 0.2 percent.
HTML
|
PDF
|
RSS
08/28/2026
The preliminary Current Employment Statistics (CES) benchmark revision for March 2026 total nonfarm employment was -79,000 (-0.1 percent); the preliminary revision for total private employment was -178,000 (-0.1 percent).
HTML
|
PDF
|
RSS
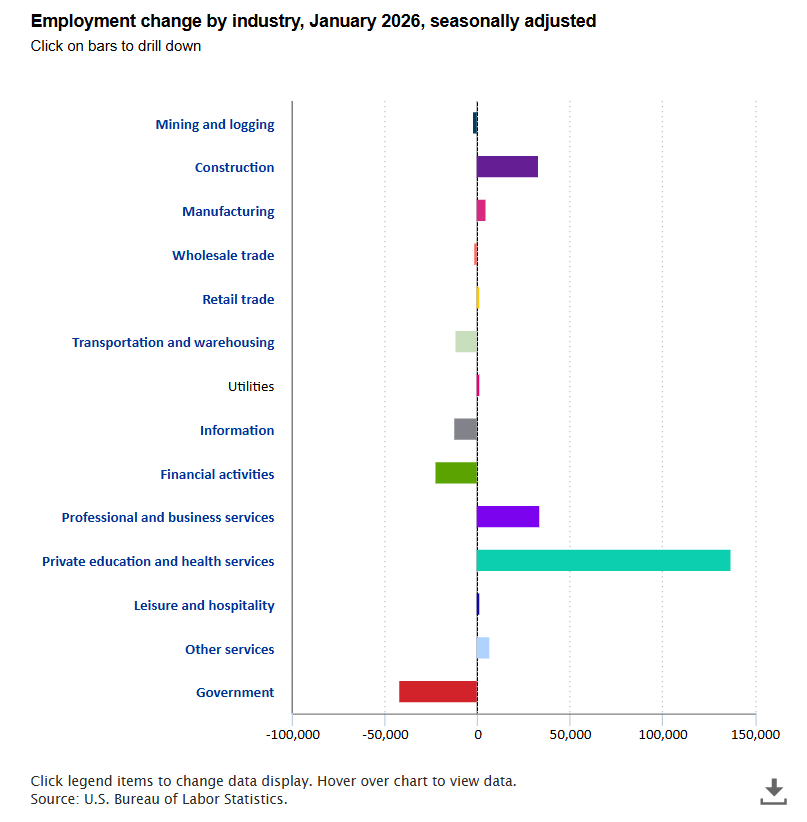
Total nonfarm payroll employment rose by 130,000 in January 2026, after changing little in 2025 (+15,000 per month on average). Job gains occurred in health care, social assistance, and construction, while federal government and financial activities lost jobs in January. read more »

Change in Total Nonfarm Payroll Employment:
+29,000(p) in Sep 2026

Change in Total Private Average Hourly Earnings for All Employees:
+$0.05(p) in Sep 2026
Change in Total Private Average Weekly Hours for All Employees:
unchanged in Sep 2026
Percent change in Total Private Aggregate Weekly Hours for All Employees:
unchanged in Sep 2026
Change in Manufacturing Average Weekly Hours for All Employees:
unchanged in Sep 2026
Change in Manufacturing Average Weekly Overtime for All Employees:
unchanged in Sep 2026
 Historical Data
 News Release
p - preliminary
News Release
p - preliminary